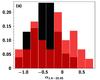
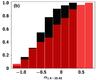
Fig. 1

Spectral index distributions. a) Comparison of the spectral index distribution for the high-RM candidates (30 sources; red histogram) and the unpolarised sources (77 sources; black histogram). The distribution of the unpolarised sources peaks at αpeak ~ −0.5. The high-RM distribution shows 3 different types of objects: steep (αpeak ~ −0.8), flat (αpeak ~ −0.1), and inverted (αpeak ~ + 0.2) spectrum radio sources. b) The same but cumulative histograms.
Current usage metrics show cumulative count of Article Views (full-text article views including HTML views, PDF and ePub downloads, according to the available data) and Abstracts Views on Vision4Press platform.
Data correspond to usage on the plateform after 2015. The current usage metrics is available 48-96 hours after online publication and is updated daily on week days.
Initial download of the metrics may take a while.