Fig. 5
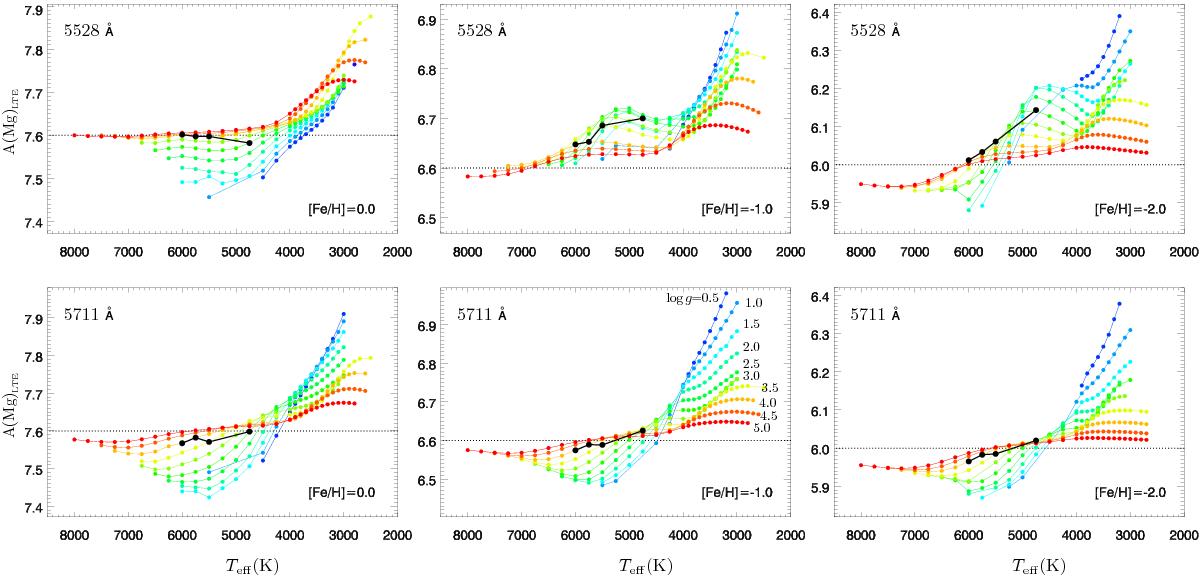
For a fixed Mg non-LTE abundance (dotted line), the Mg abundance that would be derived in LTE shown as function of Teff based on the 5528 (top) and 5711 (bottom) Å lines. Colour lines connect model atmospheres with the same log g(cm/s2). log g varies from 0.5 (blue) to 5.0 (red) dex in steps of 0.5 dex. The black points correspond to the RGB, bRGB, SGB and TOP models used in Fig. 4.
Current usage metrics show cumulative count of Article Views (full-text article views including HTML views, PDF and ePub downloads, according to the available data) and Abstracts Views on Vision4Press platform.
Data correspond to usage on the plateform after 2015. The current usage metrics is available 48-96 hours after online publication and is updated daily on week days.
Initial download of the metrics may take a while.