Fig. 4
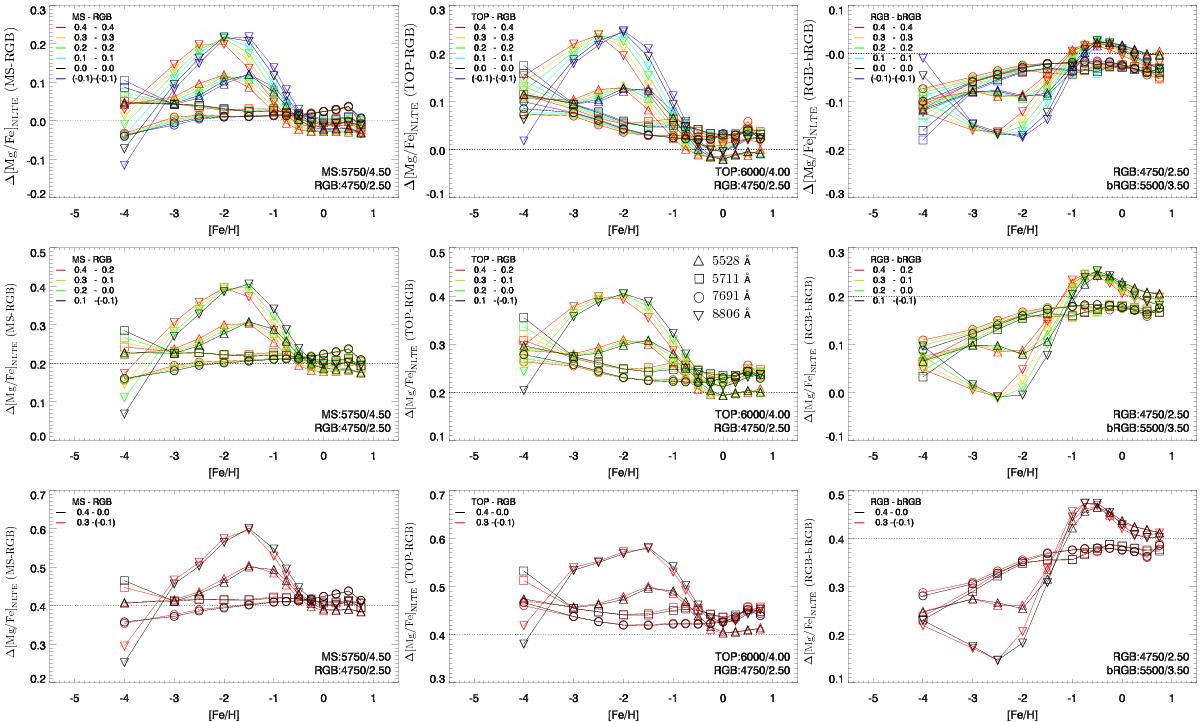
Difference in non-LTE Mg abundance Δ[Mg/Fe]NLTE versus stellar metallicity for a fixed LTE difference Δ[Mg/Fe]LTE (=0, 0.2 and 0.4 in the first, second and third row respectively), between two stars with Teff/log g parameters shown at the bottom right of each plot. The LTE difference Δ[Mg/Fe]LTE is represented by the dotted line. Colours indicate the LTE abundance [Mg/Fe]LTE for each star shown at the top-left of each plot. Four different Mg i lines were used: 5711(Λ), 7691(◯), 5528 (△) and 8806 (▽) Å. Examples of individual stars at various evolutionary stages were selected: main sequence (MS), turn off point (TOP), red giant branch (RGB) and base of the RGB (bRGB).
Current usage metrics show cumulative count of Article Views (full-text article views including HTML views, PDF and ePub downloads, according to the available data) and Abstracts Views on Vision4Press platform.
Data correspond to usage on the plateform after 2015. The current usage metrics is available 48-96 hours after online publication and is updated daily on week days.
Initial download of the metrics may take a while.