Fig. 3
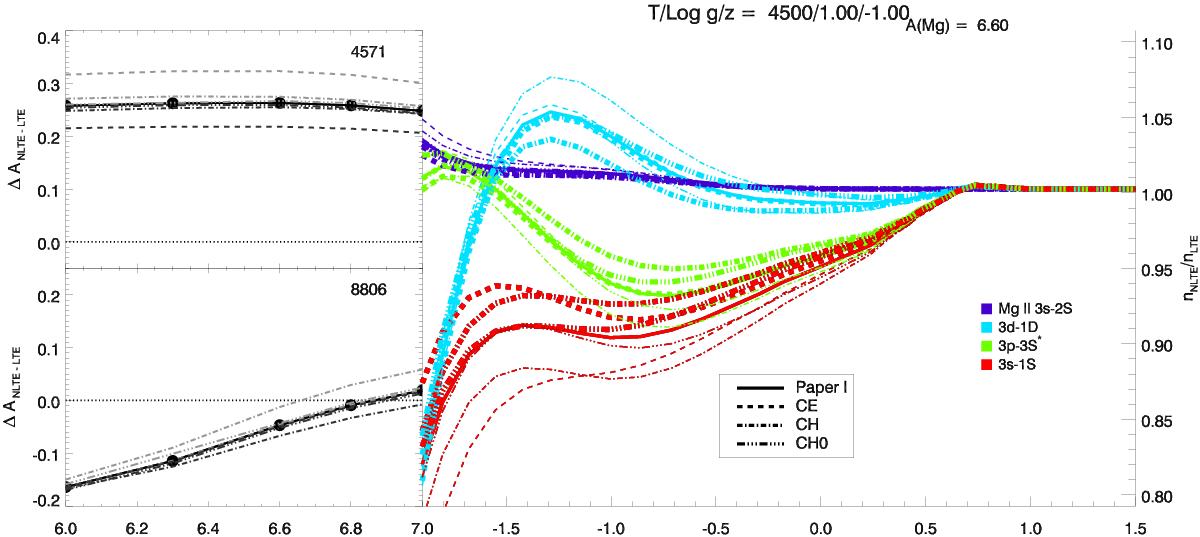
Sensitivity to collisional data in stellar model Teff/log g/[Fe /H ] = 4500/1.0/−1.0. Left: abundance corrections ΔA(Mg) for the 4571 Å (upper) and 8806 Å (lower) lines. The solid lines and dots are ΔA(Mg) calculated with the model atom F described in Paper I. Broken lines are calculations done with modified collisional rates C → C × 2.0 (black) and C → C × 0.5 (grey) from the CE (dash), CH (dot-dash) or CH0 (three-dot-dash) rates used in the F model atom and derived from recent calculations (see text). Right: departure coefficients at A(Mg) = 6.6 of the levels involved in the 8806 Å (3d 1D−3p 1P) and the 4571(3p 3P−3s 1S) transitions, together with the ground level of Mg ii, as function of optical depth. 3p 1P has a very similar behaviour to 3p 3P so it is not shown in the figure to aid visualisation. Solid and broken lines have the same description as in the left figures; thick broken lines are for C × 2.0 and thin broken lines for C × 0.5 rate coefficients.
Current usage metrics show cumulative count of Article Views (full-text article views including HTML views, PDF and ePub downloads, according to the available data) and Abstracts Views on Vision4Press platform.
Data correspond to usage on the plateform after 2015. The current usage metrics is available 48-96 hours after online publication and is updated daily on week days.
Initial download of the metrics may take a while.