Fig. 2
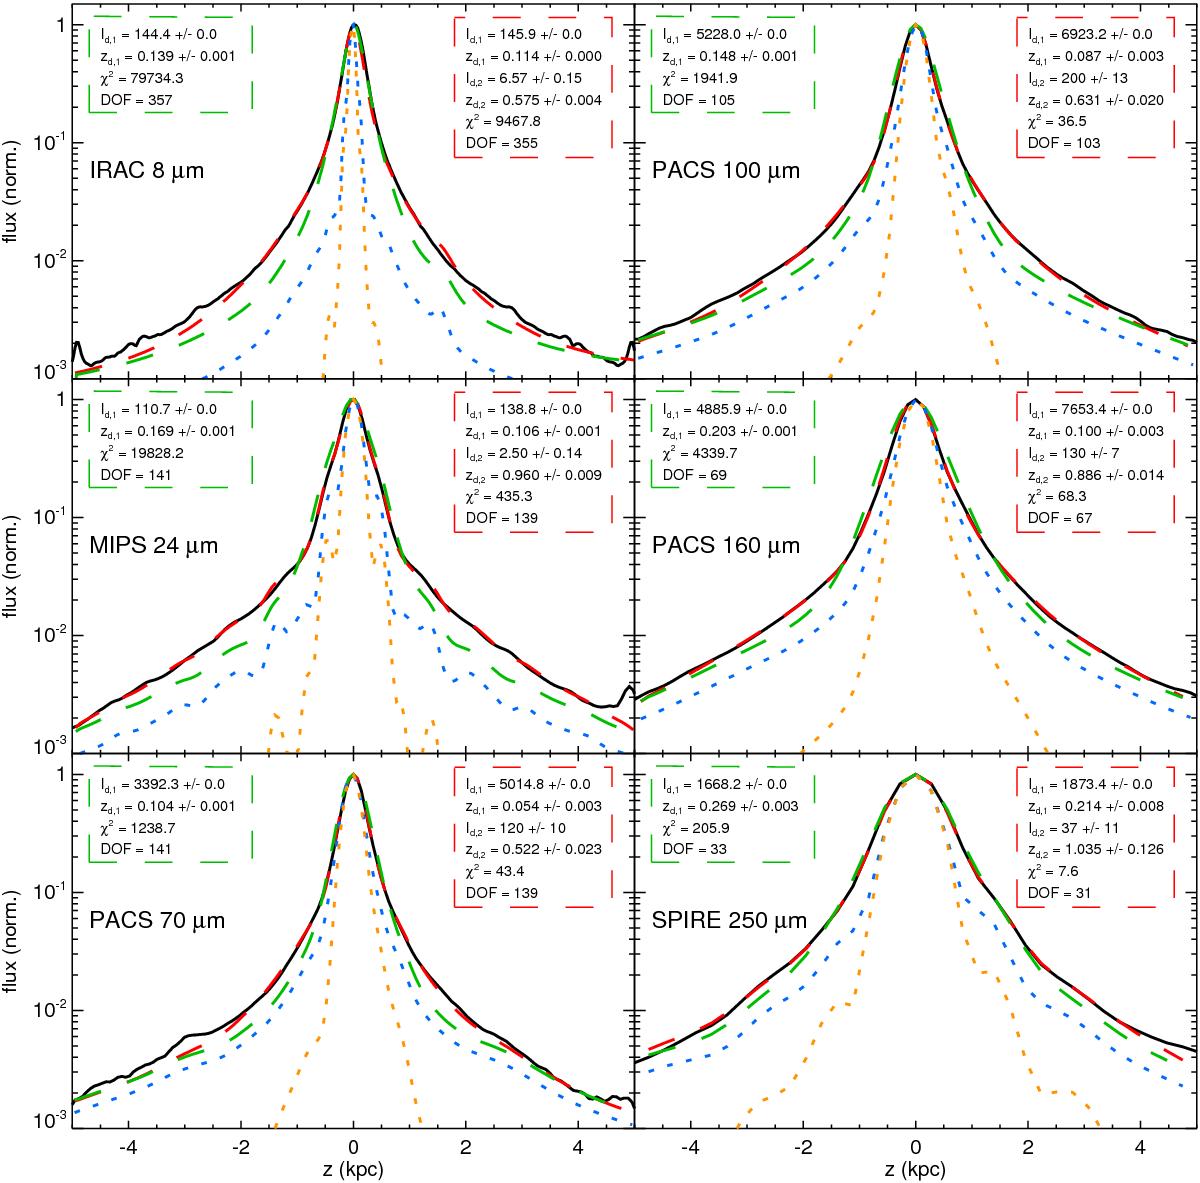
Normalised vertical profiles for observations (black solid lines). The green dashed lines are the result of the convolution of the one-component dust emission profile with the instrument LSF while the red dashed lines are the result of convolution of the two-component dust emission profile. Normalisation values are 82.03, 48.17, 1119.47, 2023.22, 1798.00, 630.58 MJy/sr for IRAC 8, MIPS 24, PACS 70, 100, 160 and SPIRE 250 μm observed profiles, respectively. Fit results are indicated in the green and red boxes, respectively (scaleheights expressed in kpc and the intrinsic surface brightness in MJy/sr). LSF and PSF vertical profiles are illustrated with blue and orange dotted lines, respectively.
Current usage metrics show cumulative count of Article Views (full-text article views including HTML views, PDF and ePub downloads, according to the available data) and Abstracts Views on Vision4Press platform.
Data correspond to usage on the plateform after 2015. The current usage metrics is available 48-96 hours after online publication and is updated daily on week days.
Initial download of the metrics may take a while.