Free Access
Fig. 8
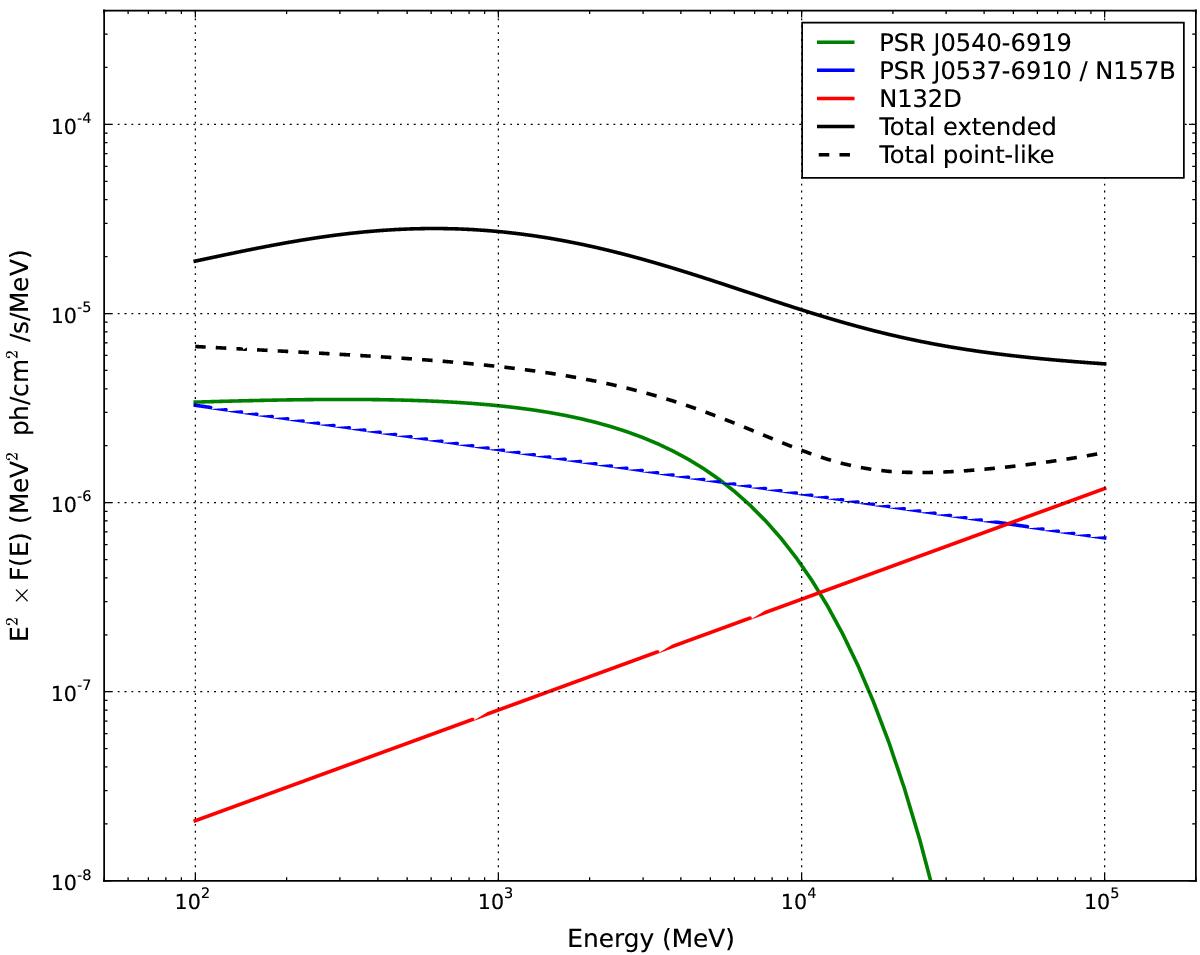
Comparison of the total emission of extended nature with that of point sources for which an established or likely association with an LMC object exists (as indicated in the legend). Best-fit analytic spectra were used and summed over components E0 to E4 to produce the black curve for the diffuse contribution.
Current usage metrics show cumulative count of Article Views (full-text article views including HTML views, PDF and ePub downloads, according to the available data) and Abstracts Views on Vision4Press platform.
Data correspond to usage on the plateform after 2015. The current usage metrics is available 48-96 hours after online publication and is updated daily on week days.
Initial download of the metrics may take a while.