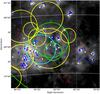
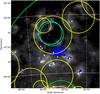
Fig. 6
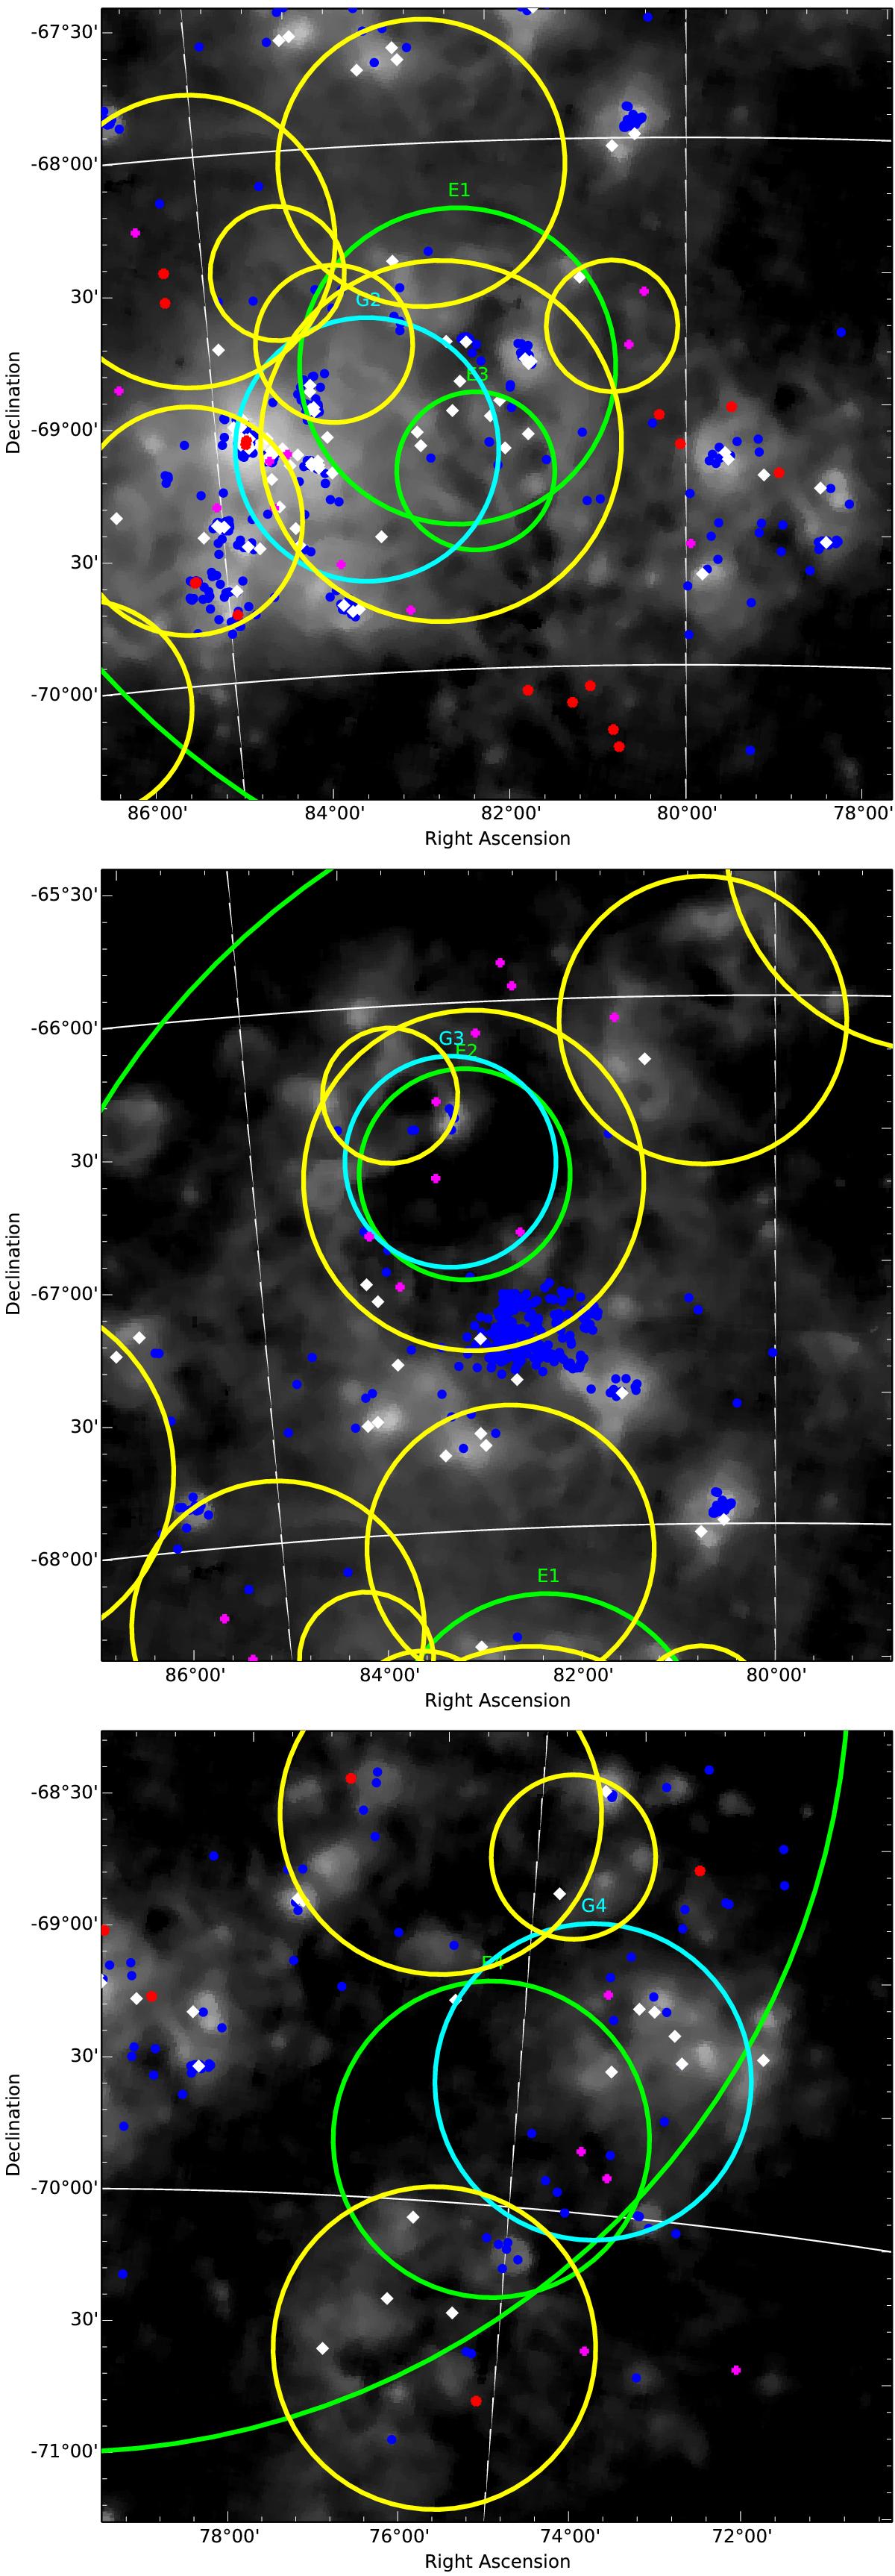
Charts illustrating the layout of each region associated with small-scale extended γ-ray emission. From top to bottom: regions around emissivity components E1+E3, E2, and E4. The background is a SHASSA Hα smoothed map on a log scale. The green circles are the 1σ extent of the Gaussian emissivity components of the emissivity model, the cyan circles are the 1σ extent of the Gaussian emission components of the analytic model. Overlaid are pulsars (magenta pluses), Wolf-Rayet stars (white diamonds), stars of spectral type B0-3 (blue dots), HMXBs (red dots), and supergiant shells (yellow circles).
Current usage metrics show cumulative count of Article Views (full-text article views including HTML views, PDF and ePub downloads, according to the available data) and Abstracts Views on Vision4Press platform.
Data correspond to usage on the plateform after 2015. The current usage metrics is available 48-96 hours after online publication and is updated daily on week days.
Initial download of the metrics may take a while.