Fig. 4
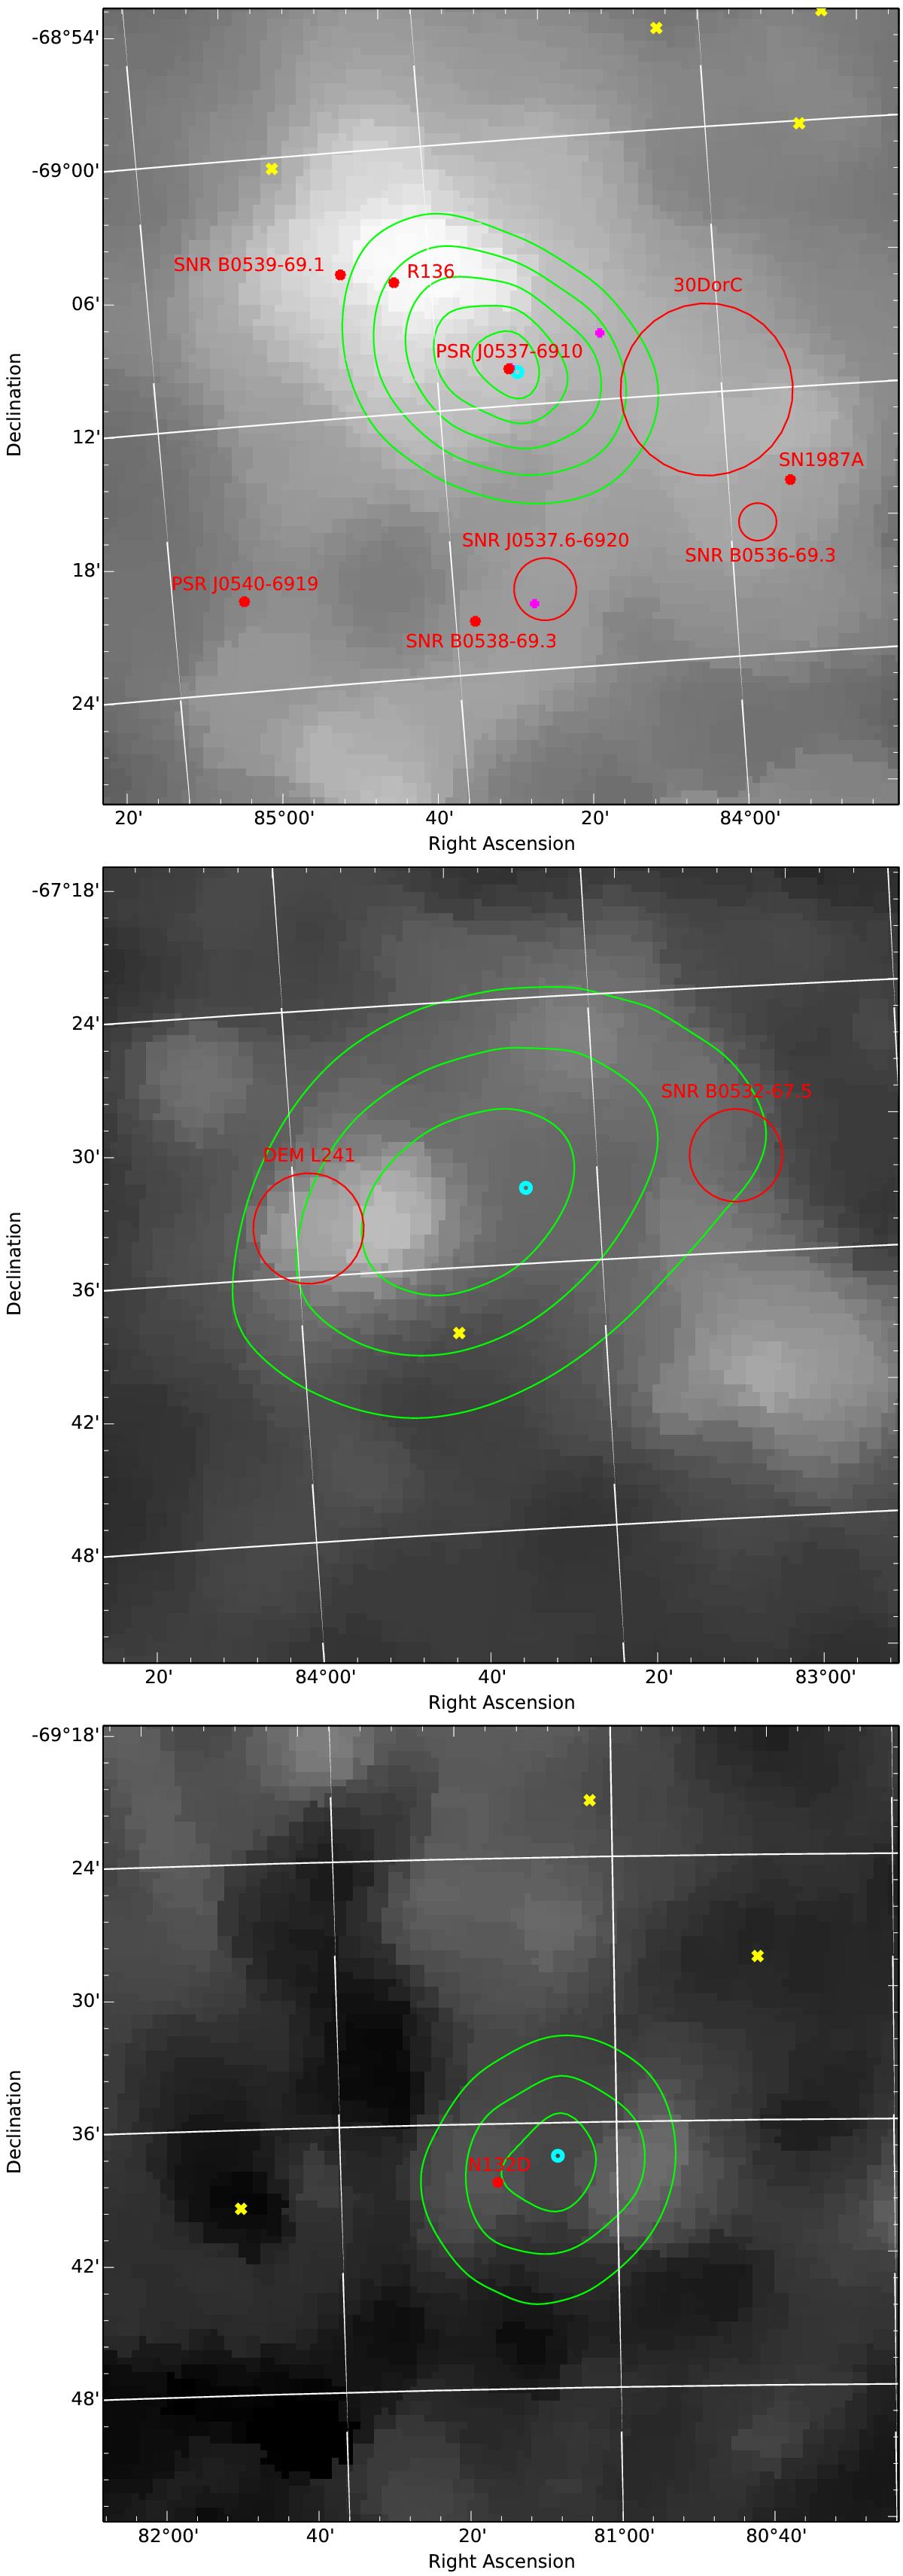
Localization maps for point sources P2, P3, and P4 (from top to bottom; P1 is identified as PSR J0540−6919 and thus not shown). Green contours correspond to 1, 2, and 3σ confidence regions derived using the emissivity model (4 and 5σ confidence regions were added to P2 to emphasise that it is not consistent with 30 Dor C); the cyan dots correspond to the best-fit positions derived using the analytic model. The background is a SHASSA Hα smoothed map on a log scale. Overlaid as red dots and circles are the position of known SNRs, including the plerions associated with PSRs J0540−6919 and J0537−6910, together with other noteworthy objects such as SN1987A or 30 Doradus C; magenta pluses indicate the positions of known pulsars, while yellow crosses indicate the positions of known active galactic nuclei.
Current usage metrics show cumulative count of Article Views (full-text article views including HTML views, PDF and ePub downloads, according to the available data) and Abstracts Views on Vision4Press platform.
Data correspond to usage on the plateform after 2015. The current usage metrics is available 48-96 hours after online publication and is updated daily on week days.
Initial download of the metrics may take a while.