Fig. 3
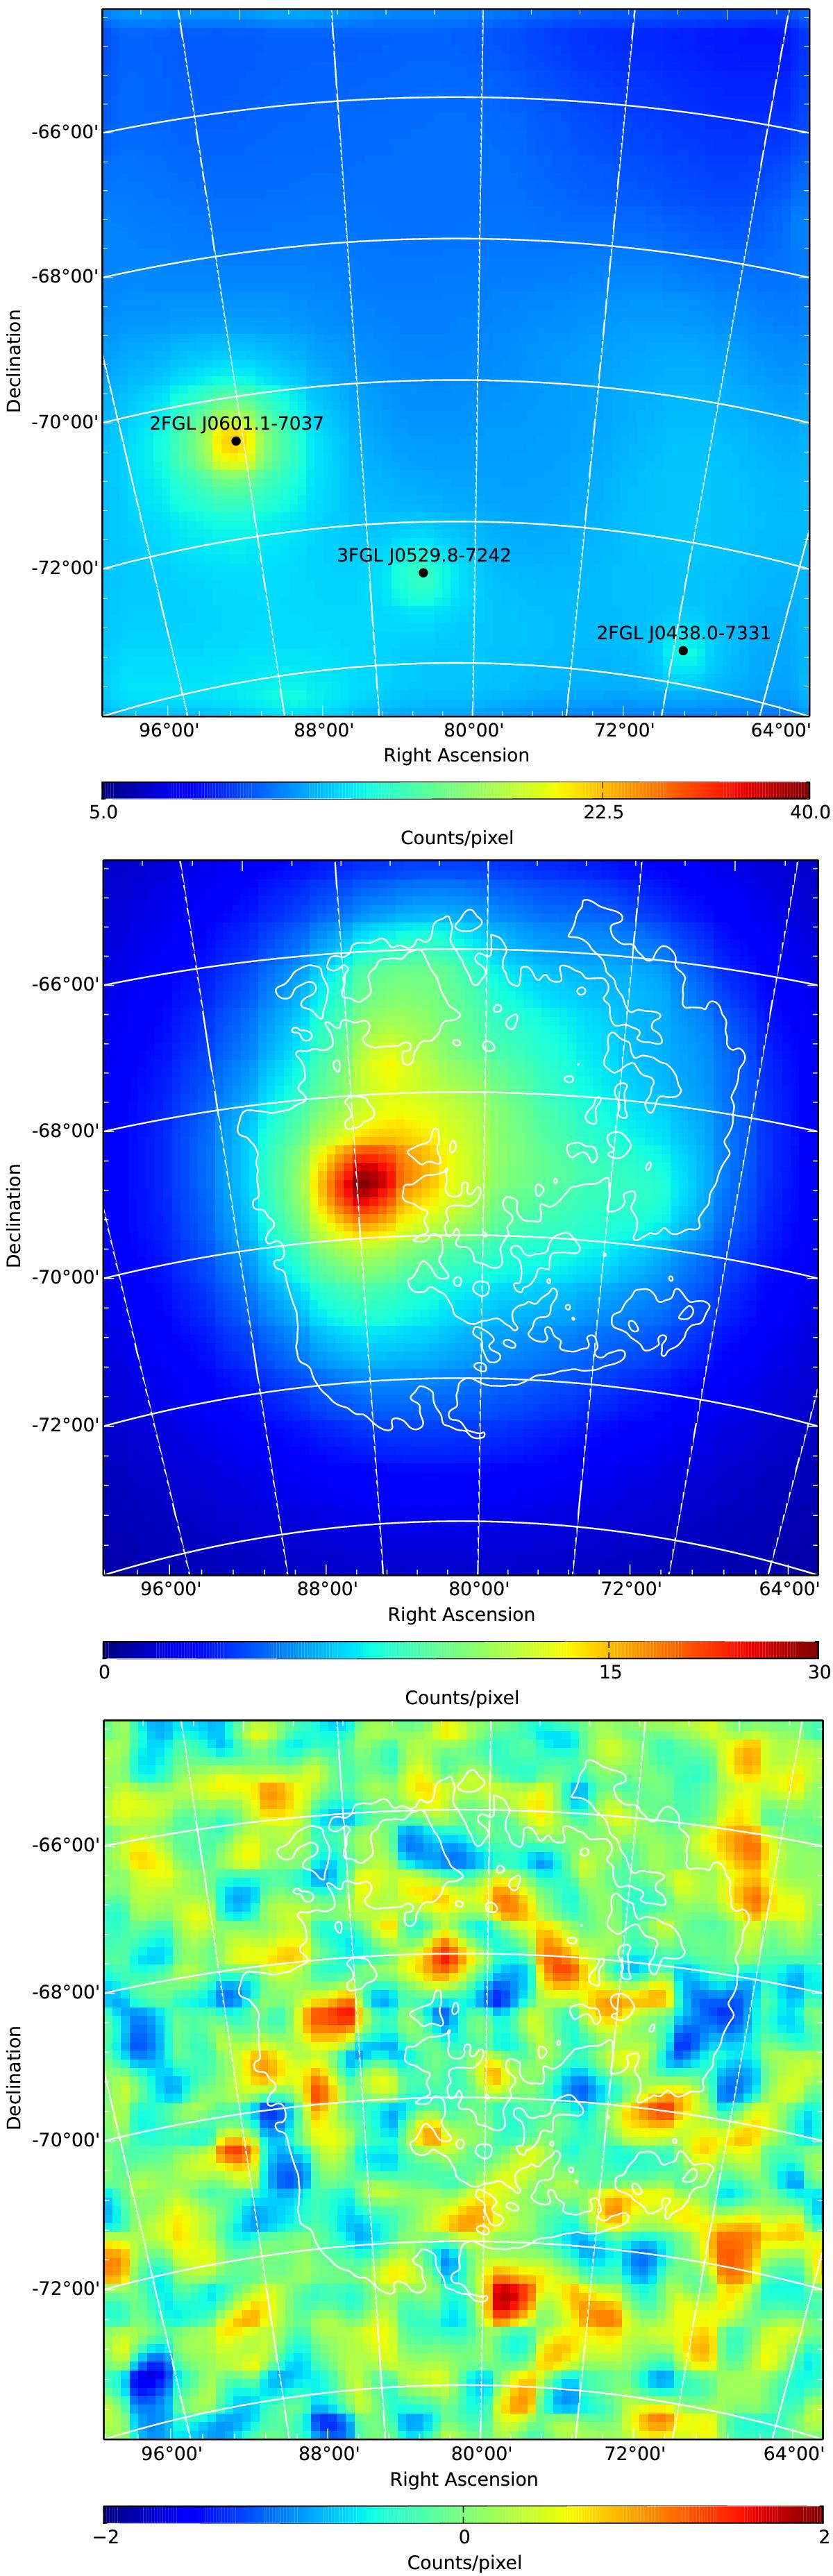
Top and middle panels: model maps of the background components and LMC components of the emissivity model in the 0.2–100 GeV band. Black dots indicate the positions of background sources in the field but outside the LMC boundaries (see Sect. 3.1). Both maps have 0.1° × 0.1° pixels and were smoothed with a Gaussian kernel with σ = 0.2°. Colours are displayed on a square-root scale. Bottom panel: residual counts map in the 0.2–100 GeV range, after subtracting the fitted emissivity model. Colours are displayed on a linear scale. White lines are defined in Fig. 1.
Current usage metrics show cumulative count of Article Views (full-text article views including HTML views, PDF and ePub downloads, according to the available data) and Abstracts Views on Vision4Press platform.
Data correspond to usage on the plateform after 2015. The current usage metrics is available 48-96 hours after online publication and is updated daily on week days.
Initial download of the metrics may take a while.