Fig. 2
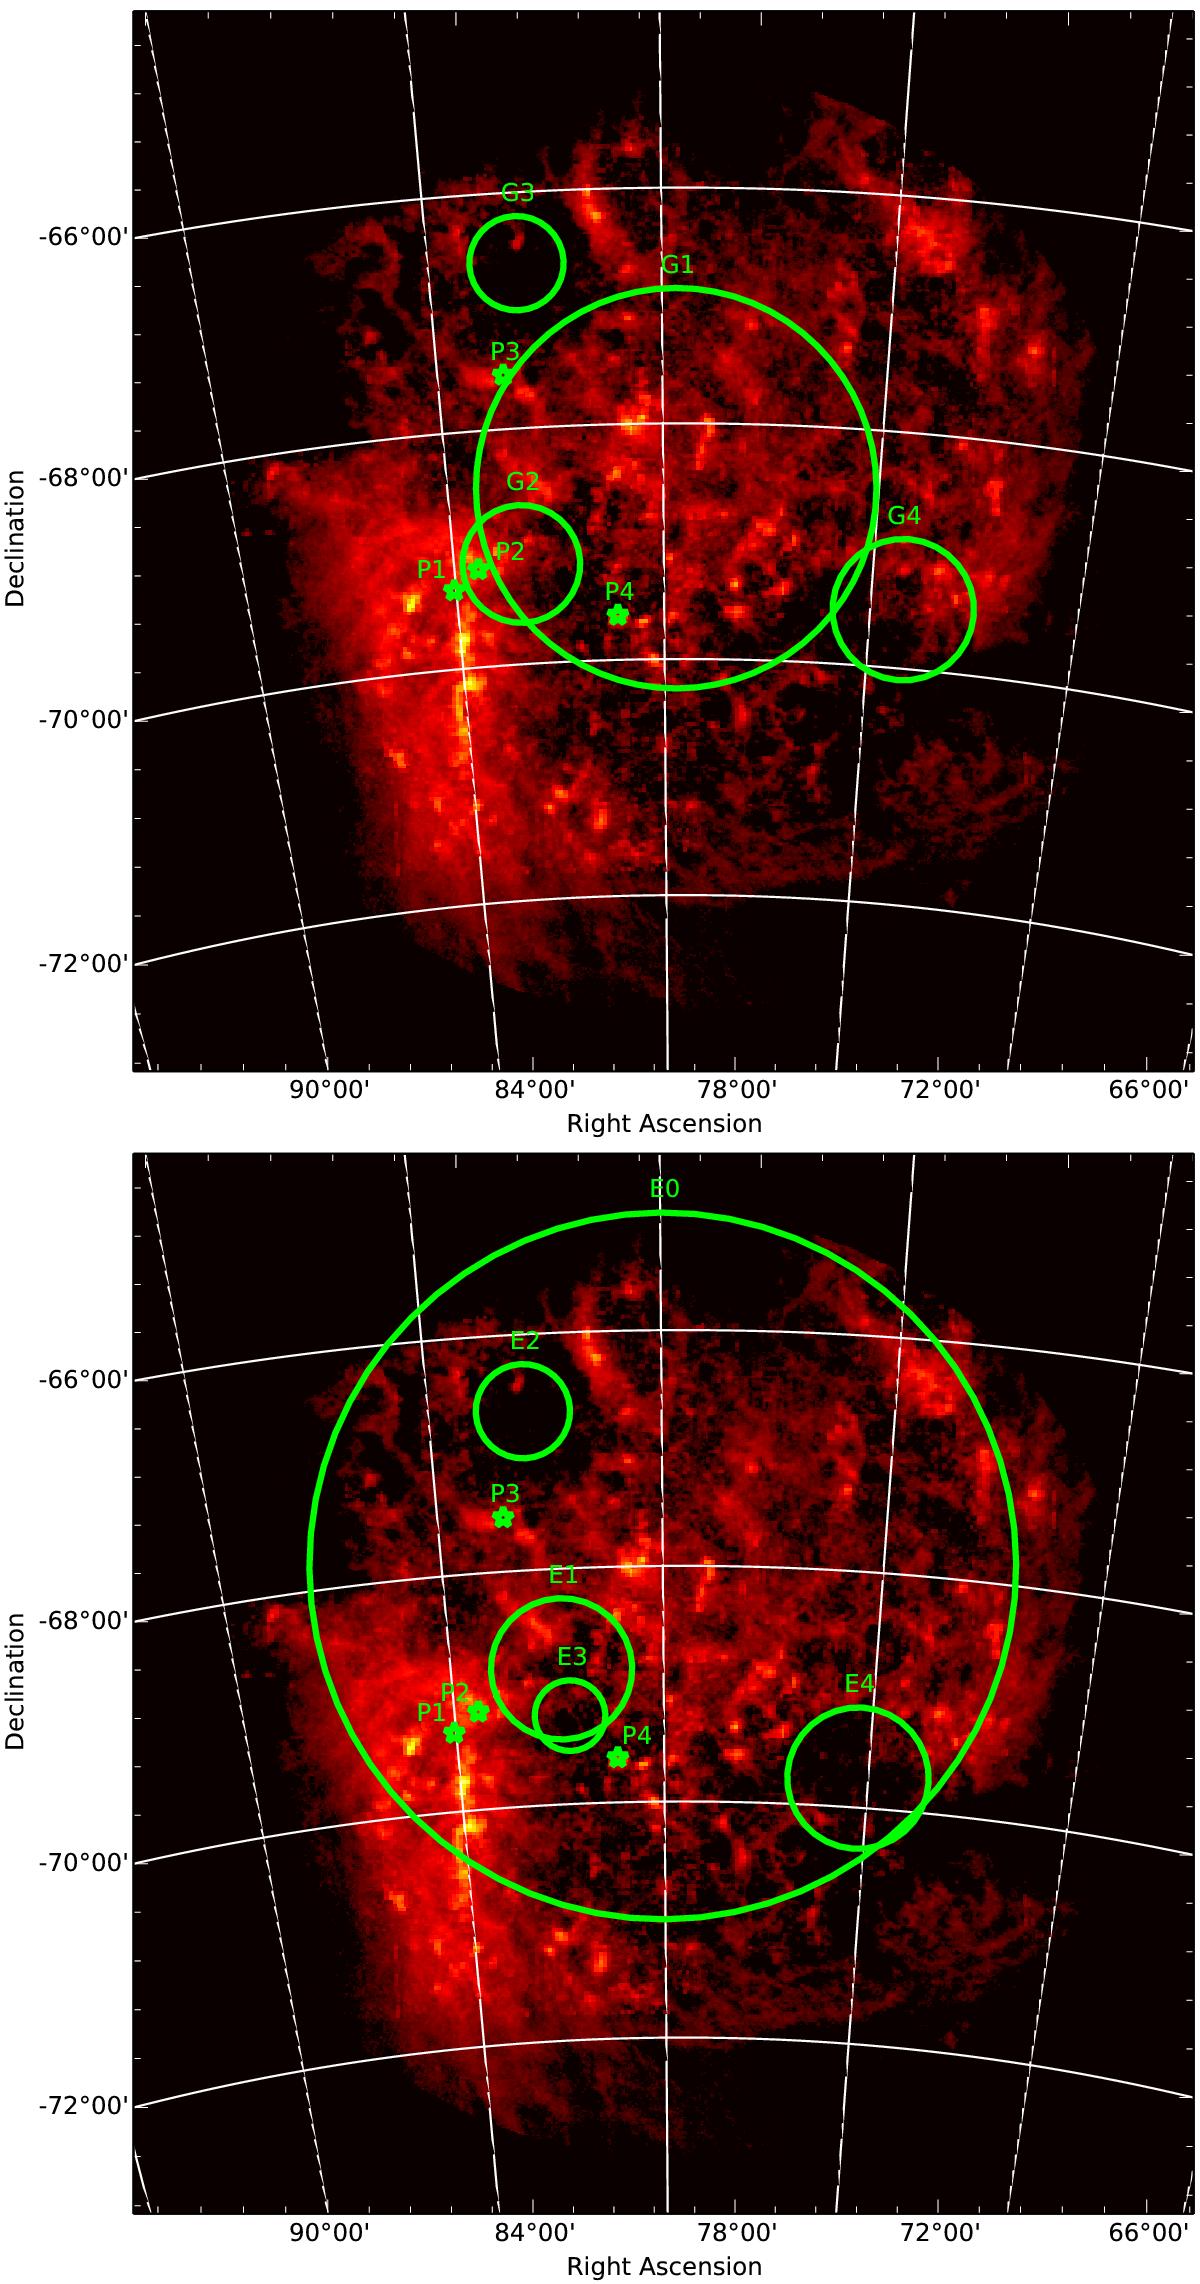
Charts illustrating the layout of the model components. Point sources are indicated by green stars. The green circles correspond to the 1σ extent of the Gaussian emission components of the analytic model (top) and to the 1σ extent of the Gaussian emissivity components of the emissivity model (bottom). The background map is the total gas column density distribution in arbitrary units and a square-root scale.
Current usage metrics show cumulative count of Article Views (full-text article views including HTML views, PDF and ePub downloads, according to the available data) and Abstracts Views on Vision4Press platform.
Data correspond to usage on the plateform after 2015. The current usage metrics is available 48-96 hours after online publication and is updated daily on week days.
Initial download of the metrics may take a while.