Fig. 1
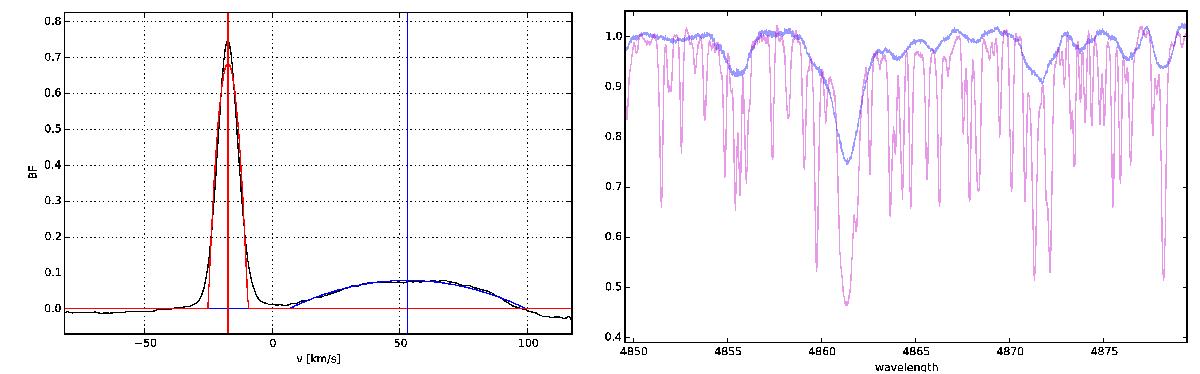
Left: broadening function profiles of TZ For derived from HARPS spectrum taken on December 6, 2010. The primary rotates synchronously (high peak on left) and the secondary’s profile is flattened because of fast rotation. Right: normalized, disentangled spectra of the primary (narrow lines) and the secondary (broad shallow lines) around of Hβ line.
Current usage metrics show cumulative count of Article Views (full-text article views including HTML views, PDF and ePub downloads, according to the available data) and Abstracts Views on Vision4Press platform.
Data correspond to usage on the plateform after 2015. The current usage metrics is available 48-96 hours after online publication and is updated daily on week days.
Initial download of the metrics may take a while.