Fig. 9
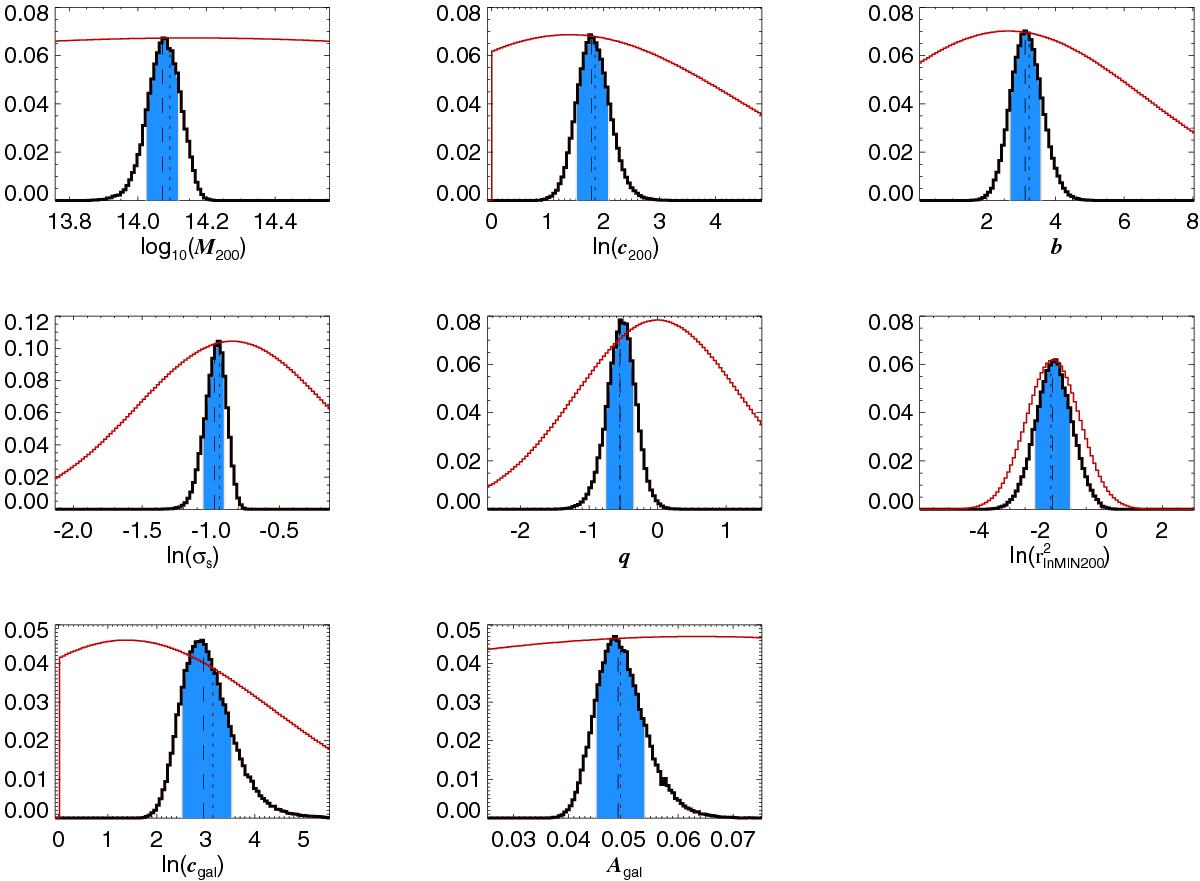
Posteriors of the fitted cluster halo model parameters for the N4z1 bin, marginalised over all other parameters. Black solid lines indicate the posterior, red lines the prior. The dashed vertical line indicates the median of the marginalised posterior, the blue shaded area is the 68% confidence interval around the median, and the dotted vertical line indicates the location of the best-fit value. Dimensions as in Table 2.
Current usage metrics show cumulative count of Article Views (full-text article views including HTML views, PDF and ePub downloads, according to the available data) and Abstracts Views on Vision4Press platform.
Data correspond to usage on the plateform after 2015. The current usage metrics is available 48-96 hours after online publication and is updated daily on week days.
Initial download of the metrics may take a while.