Fig. 7
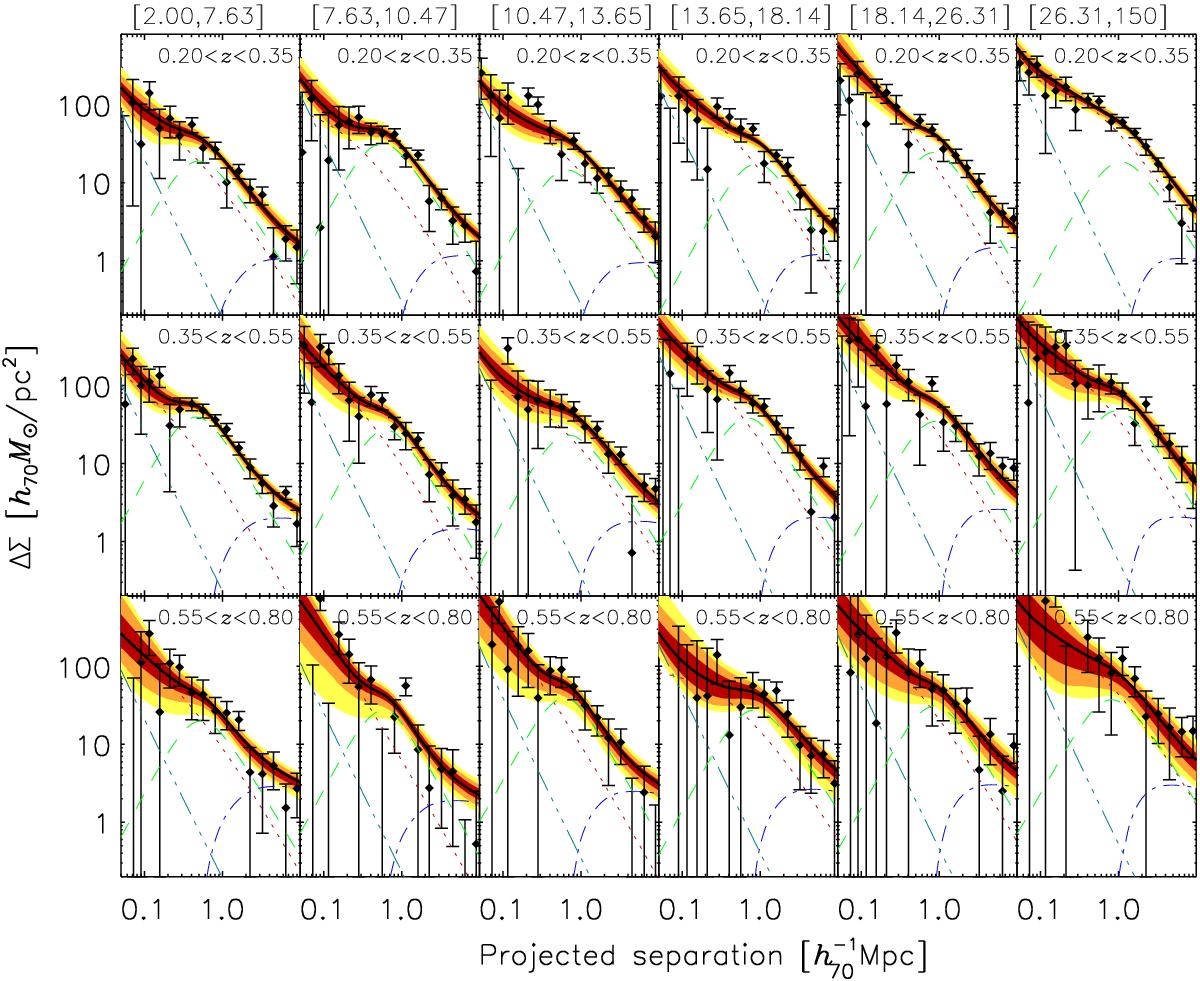
Lensing signal ΔΣ as a function of projected separation from the BCG for the different cluster samples, split in richness (as indicated on top of each column) and redshift (indicated in each panel). The solid black lines indicate the best-fit cluster halo model, simultaneously fitted to the lensing signal and the corresponding cluster-satellite correlation signal in the range 0.15 <r< 5![]() Mpc. The dotted-dotted-dashed grey line shows the contribution from the BCG, the dotted red line the contribution from correctly centred clusters, the dashed green line the contribution from miscentred clusters, and the dotted-dashed blue line the contribution from neighbouring haloes. The dark red, orange and yellow shaded areas correspond to the 1, 2 and 3σ model uncertainty.
Mpc. The dotted-dotted-dashed grey line shows the contribution from the BCG, the dotted red line the contribution from correctly centred clusters, the dashed green line the contribution from miscentred clusters, and the dotted-dashed blue line the contribution from neighbouring haloes. The dark red, orange and yellow shaded areas correspond to the 1, 2 and 3σ model uncertainty.
Current usage metrics show cumulative count of Article Views (full-text article views including HTML views, PDF and ePub downloads, according to the available data) and Abstracts Views on Vision4Press platform.
Data correspond to usage on the plateform after 2015. The current usage metrics is available 48-96 hours after online publication and is updated daily on week days.
Initial download of the metrics may take a while.