Free Access
Fig. 5
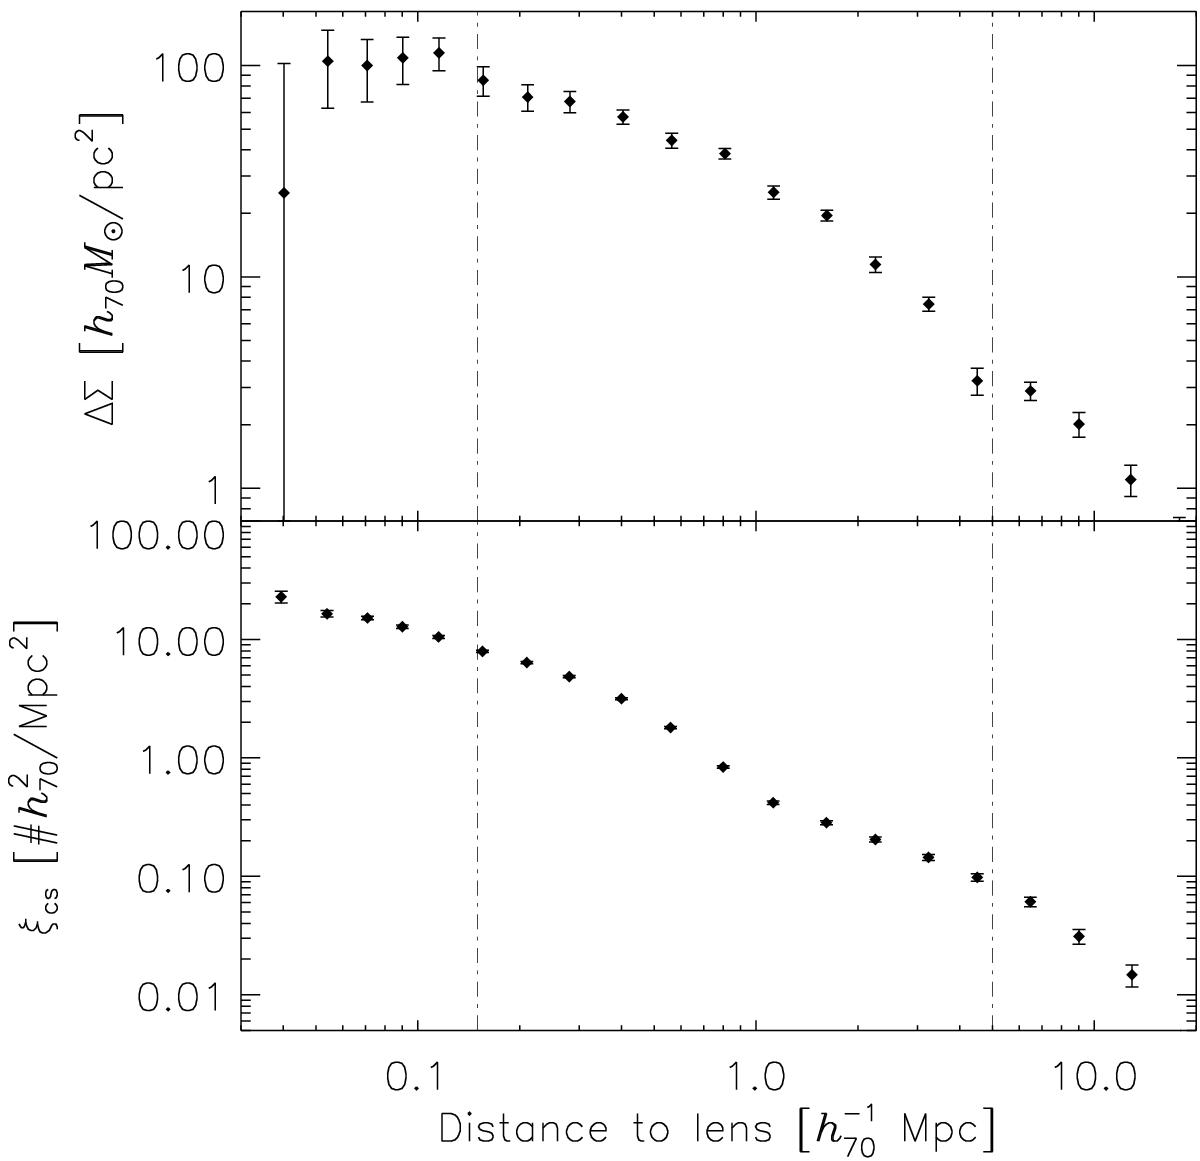
Stacked lensing signal (top) and cluster-satellite correlation (bottom) measured for all clusters with N200 > 2 and 0.2 < z < 0.8 in the RCS2. The vertical dot-dashed lines indicate the fitting range for the cluster halo model. Both measurements are shown for illustration only.
Current usage metrics show cumulative count of Article Views (full-text article views including HTML views, PDF and ePub downloads, according to the available data) and Abstracts Views on Vision4Press platform.
Data correspond to usage on the plateform after 2015. The current usage metrics is available 48-96 hours after online publication and is updated daily on week days.
Initial download of the metrics may take a while.