Fig. 3
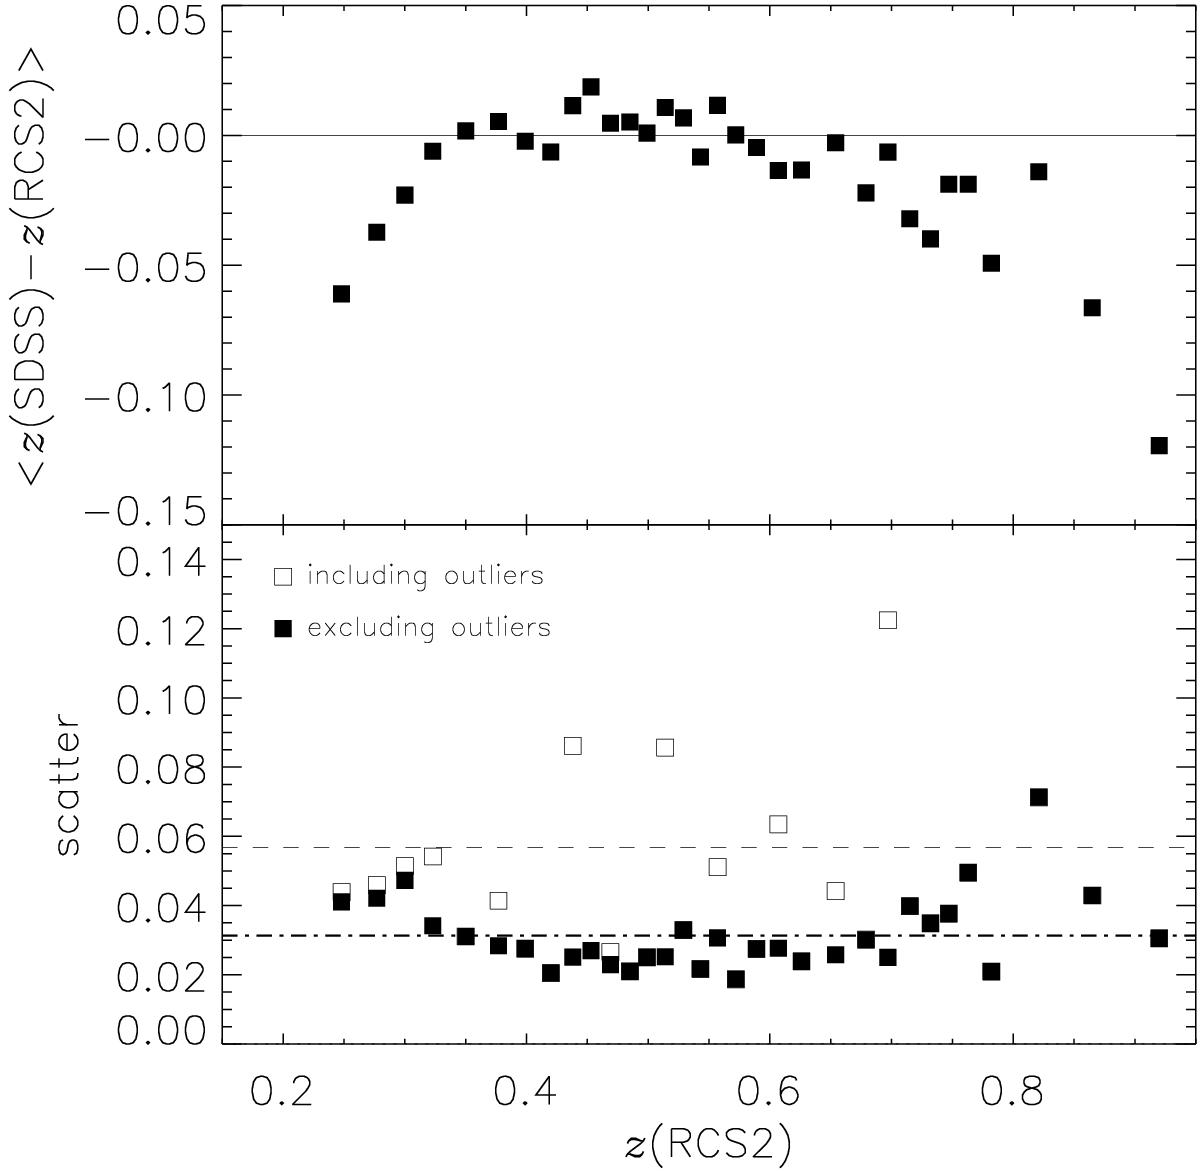
Mean difference between our “red-sequence” redshifts and the spectroscopic redshifts from SDSS (top). Scatter between the redshifts after accounting for the bias (bottom). Open symbols indicate the scatter for all matches, solid ones are obtained after removing the outliers (| zRCS2−zSDSS | > 0.15). The dashed/dotted-dashed line shows the mean scatter including/excluding outliers. We correct the mean redshift bias in our analysis.
Current usage metrics show cumulative count of Article Views (full-text article views including HTML views, PDF and ePub downloads, according to the available data) and Abstracts Views on Vision4Press platform.
Data correspond to usage on the plateform after 2015. The current usage metrics is available 48-96 hours after online publication and is updated daily on week days.
Initial download of the metrics may take a while.