Fig. A.2
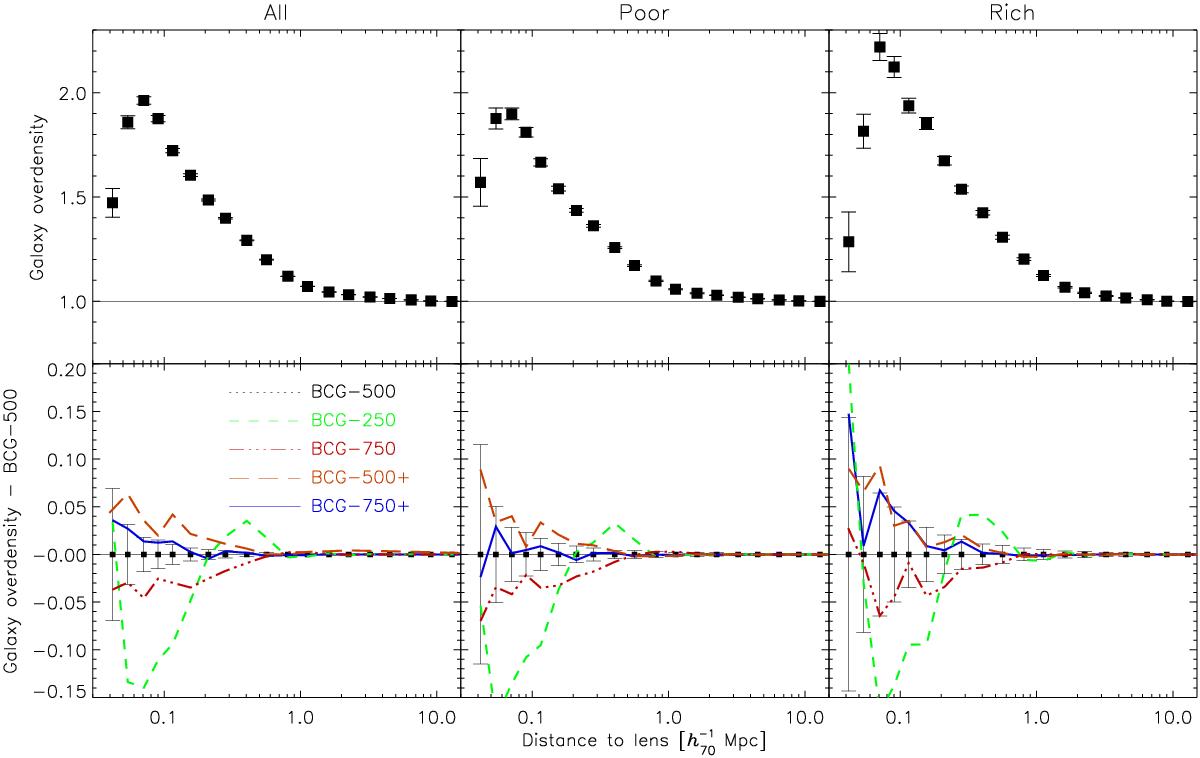
Fractional galaxy overdensity around BCG candidates selected with the reference “BCG-500” algorithm (top panels). The bottom panels show the difference in galaxy overdensity between various BCG selection algorithms and the reference. The left-hand column shows the results for all clusters, the middle one for poor clusters only and the right-hand panel for rich clusters only. The error on the difference is simply approximated by the error on the reference overdensity measurement – the true error will only be slightly larger due to the large covariance of the results. The “BCG-500+” leads to the highest, most concentrated peak, indicating that these BCGs are closest to the centre of the cluster member distribution.
Current usage metrics show cumulative count of Article Views (full-text article views including HTML views, PDF and ePub downloads, according to the available data) and Abstracts Views on Vision4Press platform.
Data correspond to usage on the plateform after 2015. The current usage metrics is available 48-96 hours after online publication and is updated daily on week days.
Initial download of the metrics may take a while.