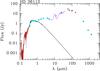
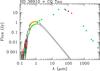
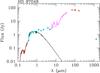
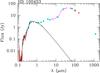
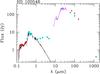
Fig. A.1
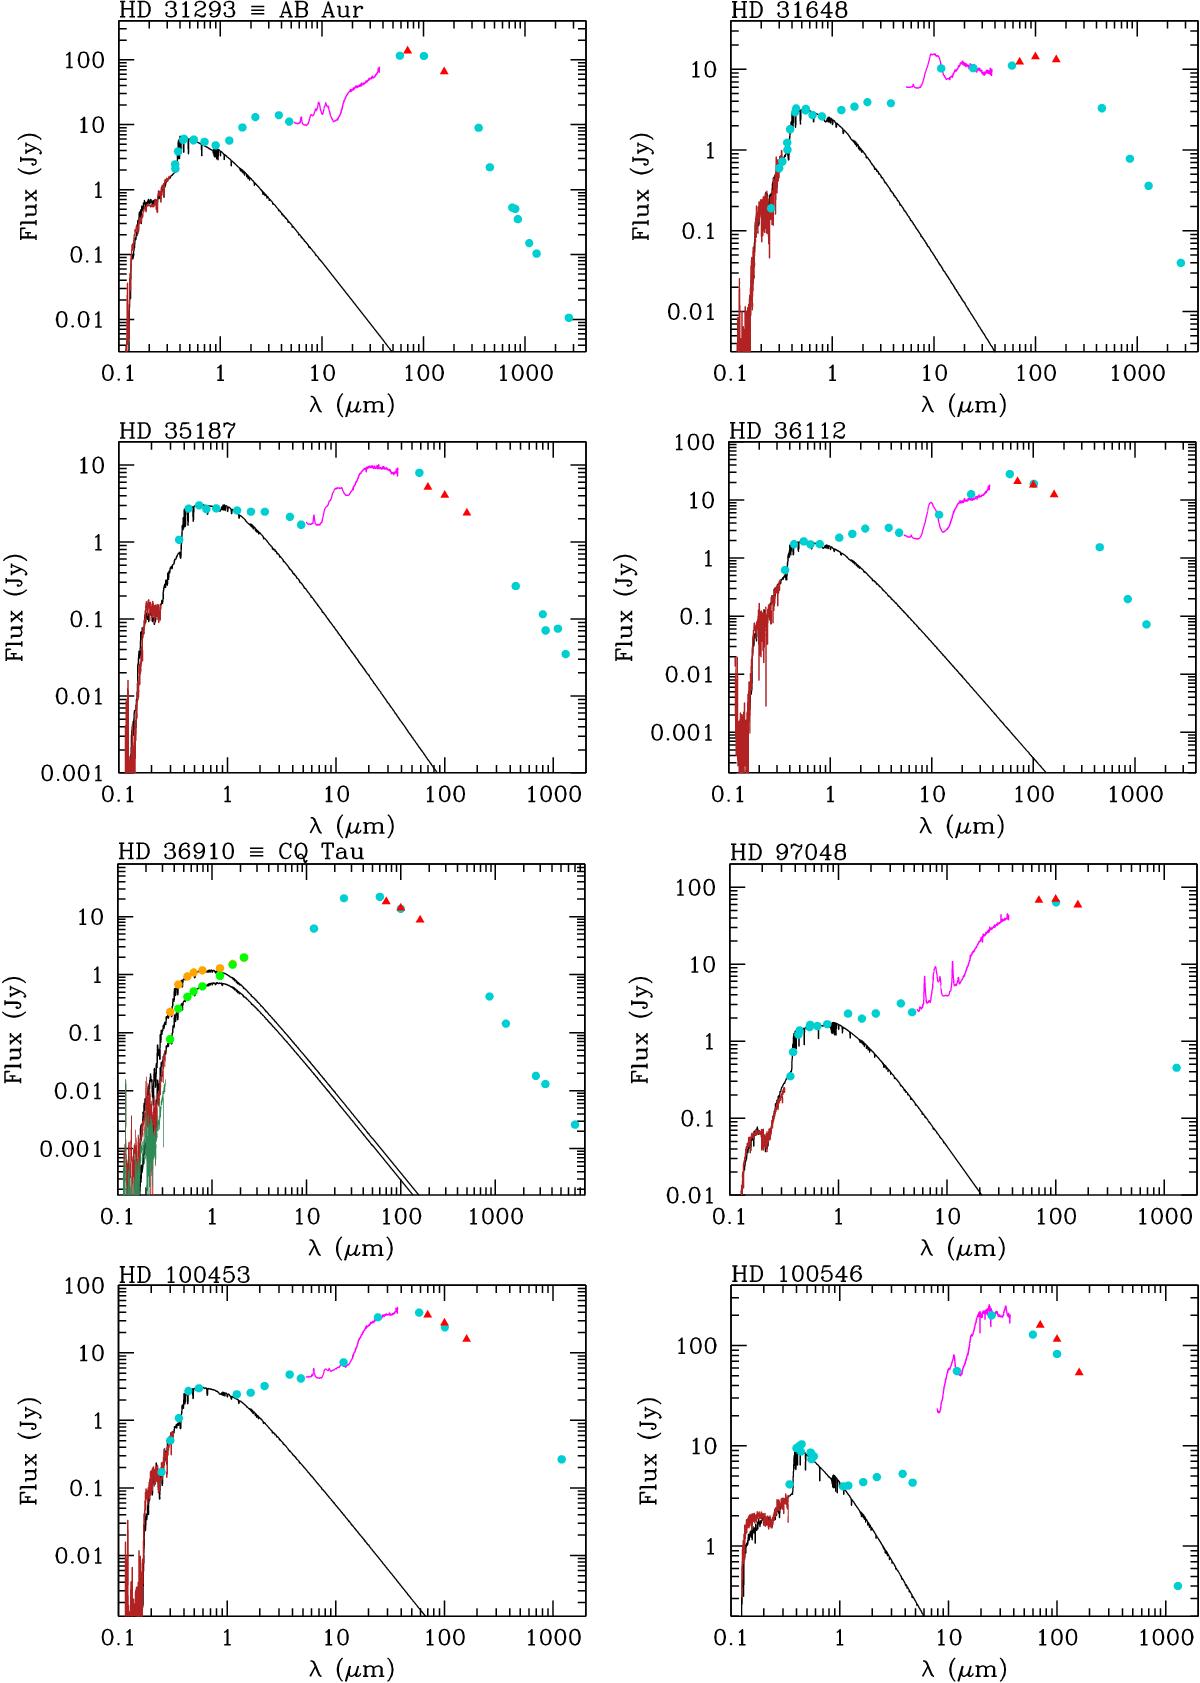
SEDs of GASPS Herbig Ae/Be stars. PACS fluxes reported in this work can be identified with red triangles. Red arrows are 3σ upper limits. Blue circles correspond to literature data from Table A.2. The solid dark red line shows IUE spectrum and purple line for the Spitzer/IRS spectrum. The solid black line is the PHOENIX/Gaia model fitted to the stellar photospheric emission.
Current usage metrics show cumulative count of Article Views (full-text article views including HTML views, PDF and ePub downloads, according to the available data) and Abstracts Views on Vision4Press platform.
Data correspond to usage on the plateform after 2015. The current usage metrics is available 48-96 hours after online publication and is updated daily on week days.
Initial download of the metrics may take a while.