Fig. A.2
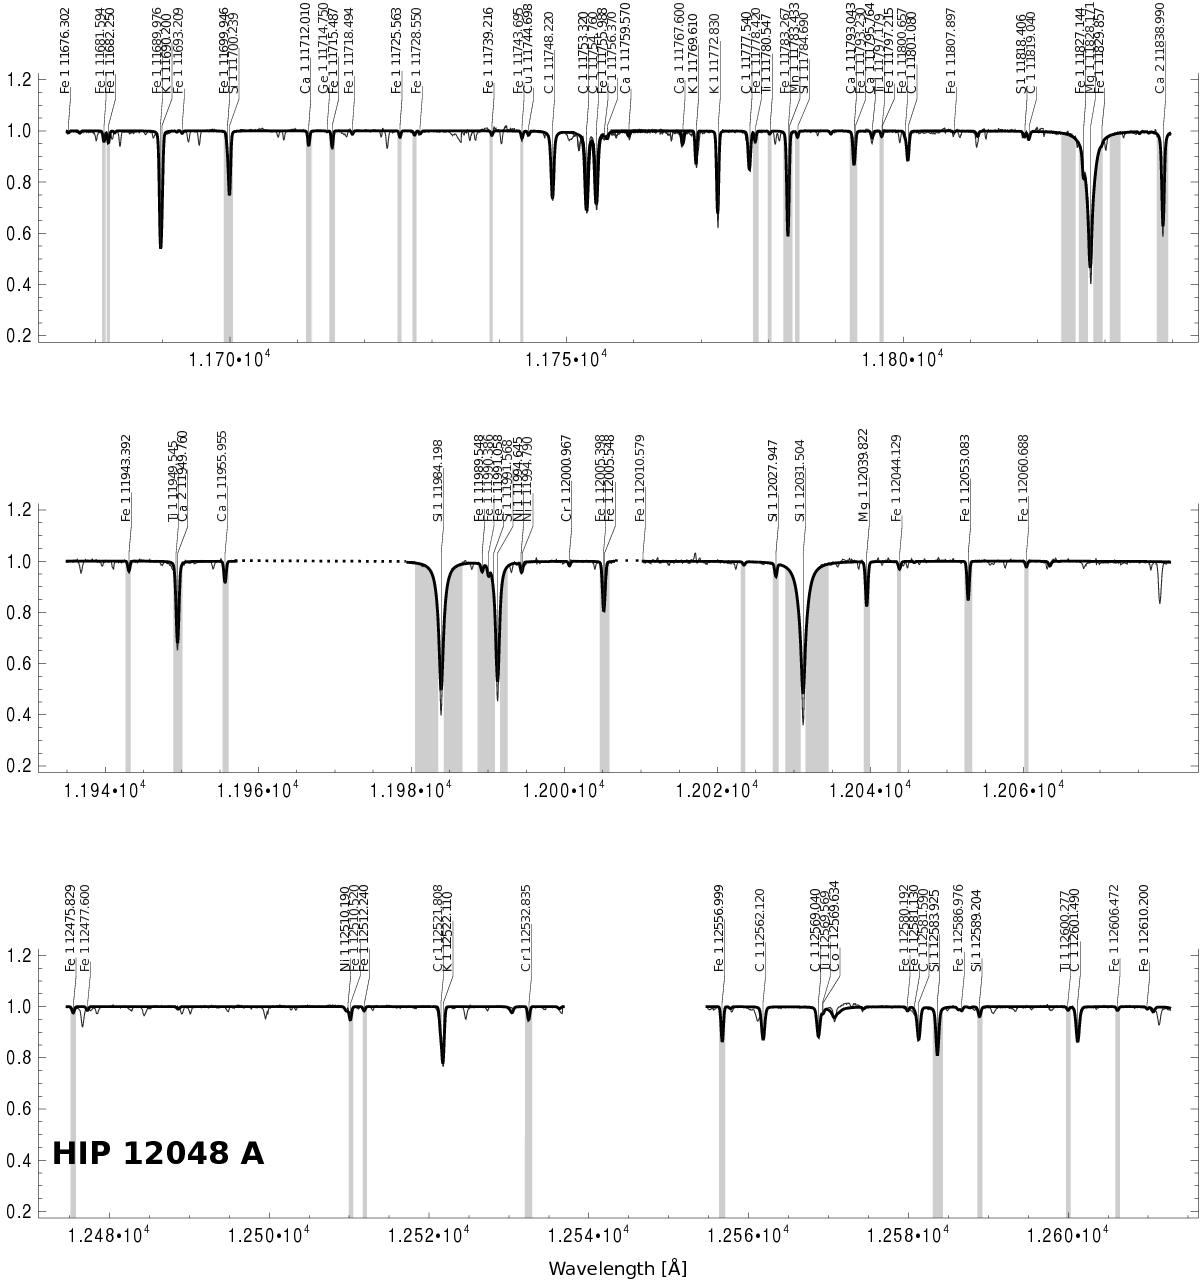
Our obtained spectra after continuum rectification, wavelength correction, and removal of telluric features of the G dwarf HIP 12048 A. The best-fit synthetic spectrum calculated with SME is shown as the overplotted thick black line. The line mask used for the metallicity determination is indicated by grey shading. The dotted lines indicate two parts that we had to remove from the spectra since a large unphysical absorption feature was present in the observed spectrum of the standard star. Spectra centred at 1177, 1811, and 1204 nm have been co-added where they overlap in this figure. White spacing represents wavelength regions between two chips. We note that the observations centred at 1303 nm have not been used in the analysis owing to problems with the observed spectra in this wavelength for target HIP 12048 A.
Current usage metrics show cumulative count of Article Views (full-text article views including HTML views, PDF and ePub downloads, according to the available data) and Abstracts Views on Vision4Press platform.
Data correspond to usage on the plateform after 2015. The current usage metrics is available 48-96 hours after online publication and is updated daily on week days.
Initial download of the metrics may take a while.