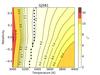
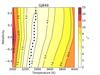
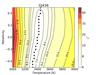
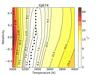
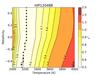
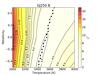
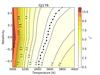
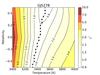
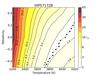
Fig. 2
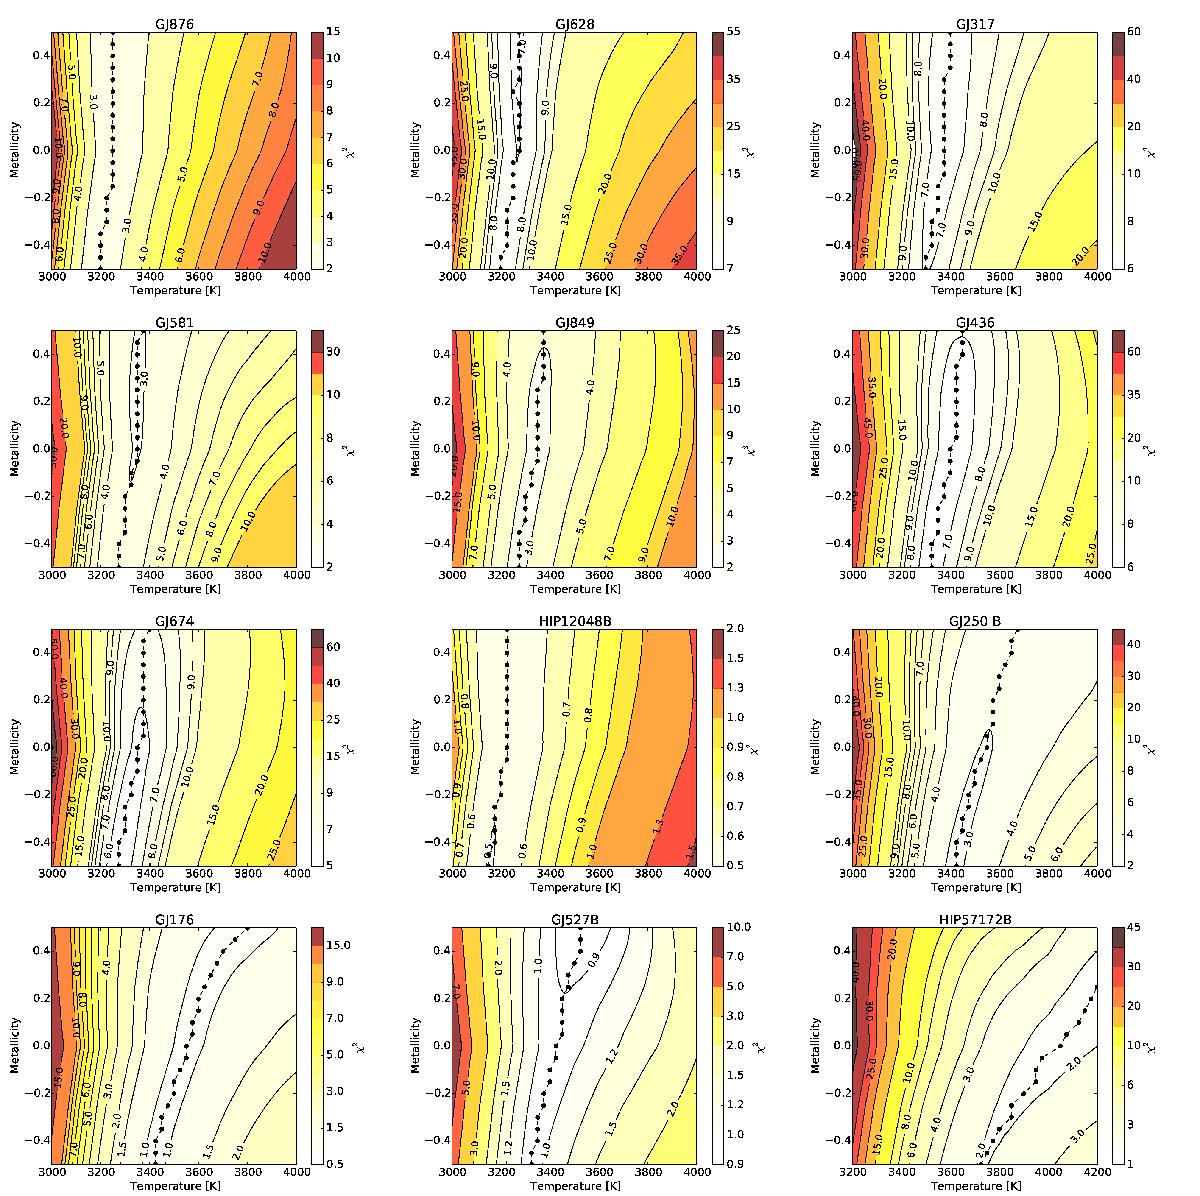
Demonstration of FeH line strength dependency on the effective temperature and overall metallicity. The contour plots in this figure show the calculated χ2 of the fit based on a grid of metallicity and effective temperature of all M dwarfs. The block lines and dots indicate the temperature with the minimum χ2 for each step in metallicity. The plots are shown in order of spectral type, starting from the coolest going towards the warmest target in our sample. For the eight coolest stars, the χ2 value strongly depends on the effective temperature, with only a weak dependency on the metallicity. For the warmer stars (above 3400 K) a slight dependency on effective temperature can be seen, and for the warmest M dwarf HIP 57172 B (M0-M1) in our sample, a clear degeneracy between metallicity and effective temperature is found and this method cannot be used to determine the effective temperature for this target.
Current usage metrics show cumulative count of Article Views (full-text article views including HTML views, PDF and ePub downloads, according to the available data) and Abstracts Views on Vision4Press platform.
Data correspond to usage on the plateform after 2015. The current usage metrics is available 48-96 hours after online publication and is updated daily on week days.
Initial download of the metrics may take a while.