Free Access
Fig. 5
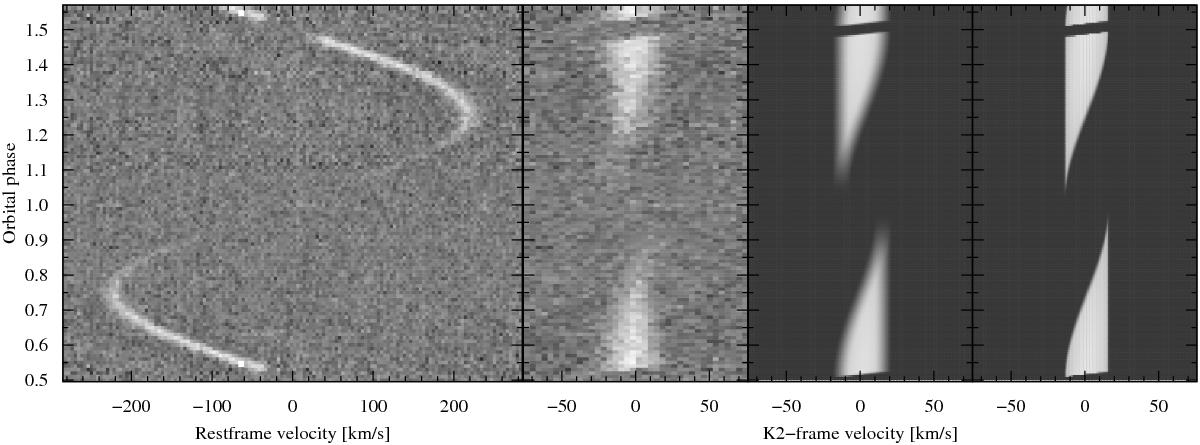
Greyscale plot of the sum of all the metal lines in the rest frame of the system (left) and shifted to the rest frame of the secondary (middle). The last two panels show a geometrical model-line profile for comparison, with the first having been subjected to a Gaussian broadening.
Current usage metrics show cumulative count of Article Views (full-text article views including HTML views, PDF and ePub downloads, according to the available data) and Abstracts Views on Vision4Press platform.
Data correspond to usage on the plateform after 2015. The current usage metrics is available 48-96 hours after online publication and is updated daily on week days.
Initial download of the metrics may take a while.