Fig. 3
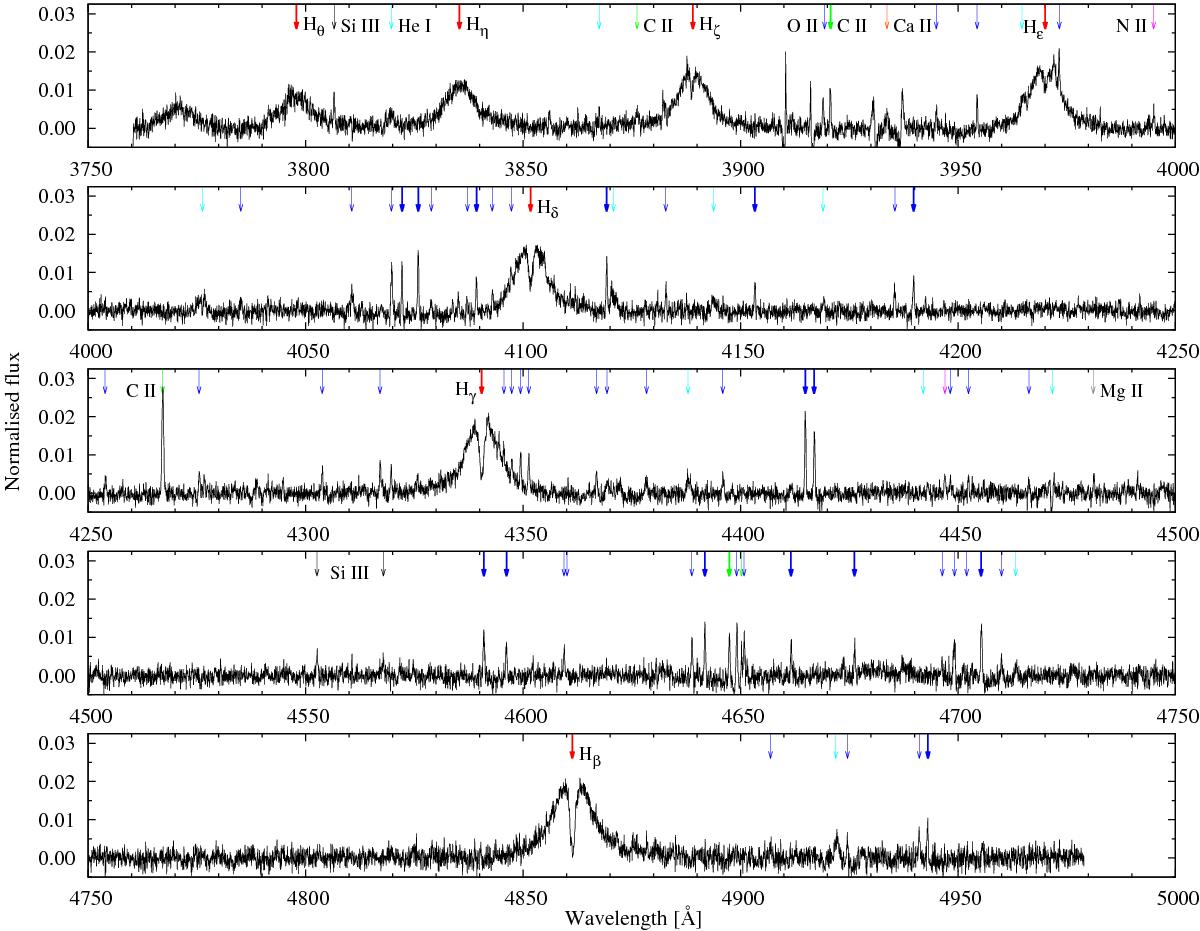
Emission line spectrum of the secondary. This figure was generated in the same way as for the top-left panel of Fig. 2, but for the full spectroscopic range. The arrows indicate the lines we have identified, while thick arrows indicate those that were used in our radial-velocity analysis. (The color coding on the arrows identifies their species; Balmer lines: red, O ii: blue, C ii and C iii: green, He i: cyan, N ii: purple, Si iii: black, Mg ii: gray.)
Current usage metrics show cumulative count of Article Views (full-text article views including HTML views, PDF and ePub downloads, according to the available data) and Abstracts Views on Vision4Press platform.
Data correspond to usage on the plateform after 2015. The current usage metrics is available 48-96 hours after online publication and is updated daily on week days.
Initial download of the metrics may take a while.