Fig. 2
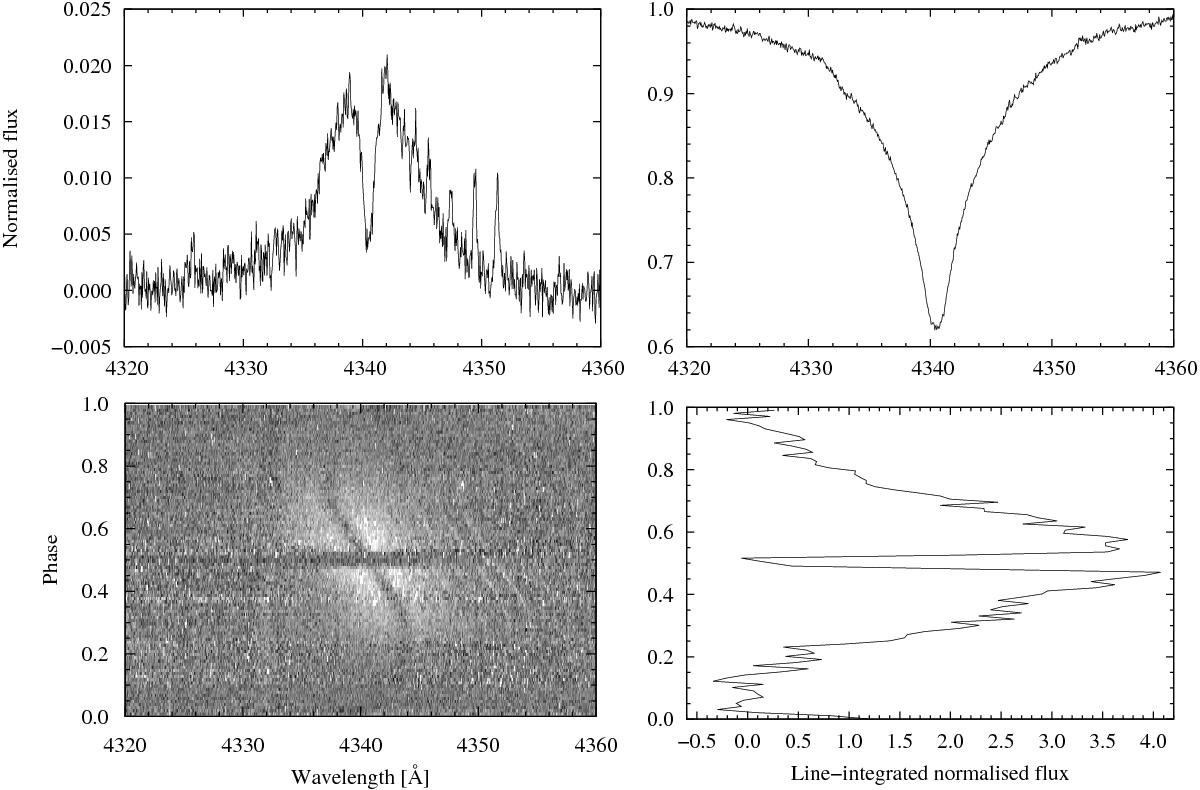
Greyscale plot (lower-left panel) showing the phase folded spectra in the region around Hγ, after shifting to the rest frame of the primary and subtracting the mean spectrum (upper-right panel) computed from the least contaminated phases. After shifting to the rest frame of the secondary and summing all phases, the emission profile of the secondary emerges (upper-left panel). Summing each phase-binned spectrum in a window 20 Å wide, and centred on Hγ in the rest frame of the secondary, produces the phase profile shown in the lower-right panel.
Current usage metrics show cumulative count of Article Views (full-text article views including HTML views, PDF and ePub downloads, according to the available data) and Abstracts Views on Vision4Press platform.
Data correspond to usage on the plateform after 2015. The current usage metrics is available 48-96 hours after online publication and is updated daily on week days.
Initial download of the metrics may take a while.