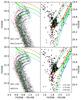
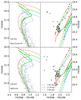
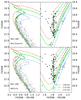
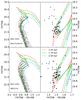
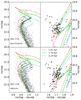
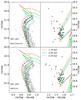
Fig. A.1
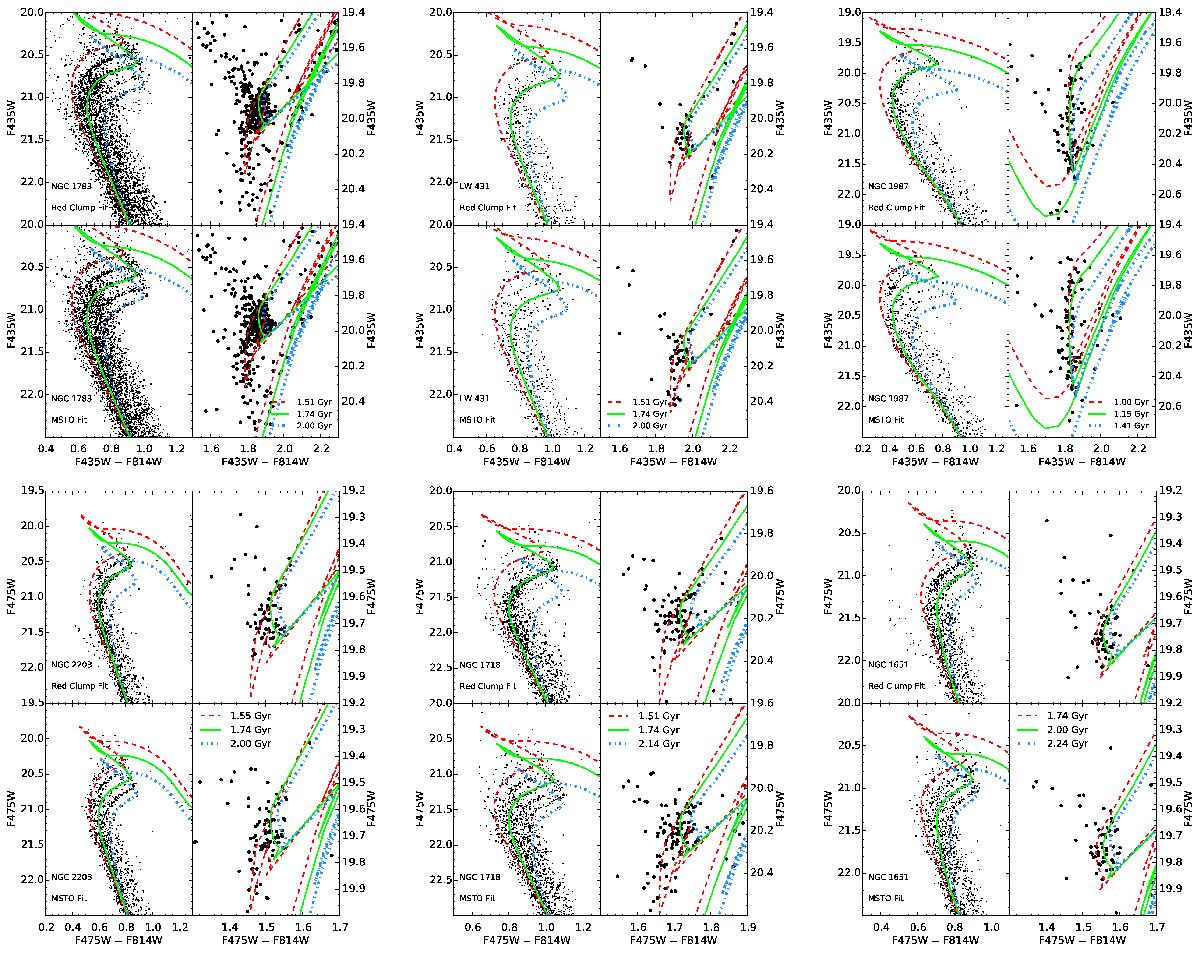
CMDs of artificial clusters constructed from the fitted SFHs of our sample of LMC clusters. The upper two panels of each subplot show clusters created out of the fitted SFH of the red clump region, whereas the lower panels are synthetic clusters with the recovered SFH from the MSTO region. All CMDs have the same limits as the CMDs of the real counterparts shown in Figs. 5, 6 and B.1 to B.10. The superimposed isochrones are also the same.
Current usage metrics show cumulative count of Article Views (full-text article views including HTML views, PDF and ePub downloads, according to the available data) and Abstracts Views on Vision4Press platform.
Data correspond to usage on the plateform after 2015. The current usage metrics is available 48-96 hours after online publication and is updated daily on week days.
Initial download of the metrics may take a while.