Fig. 7
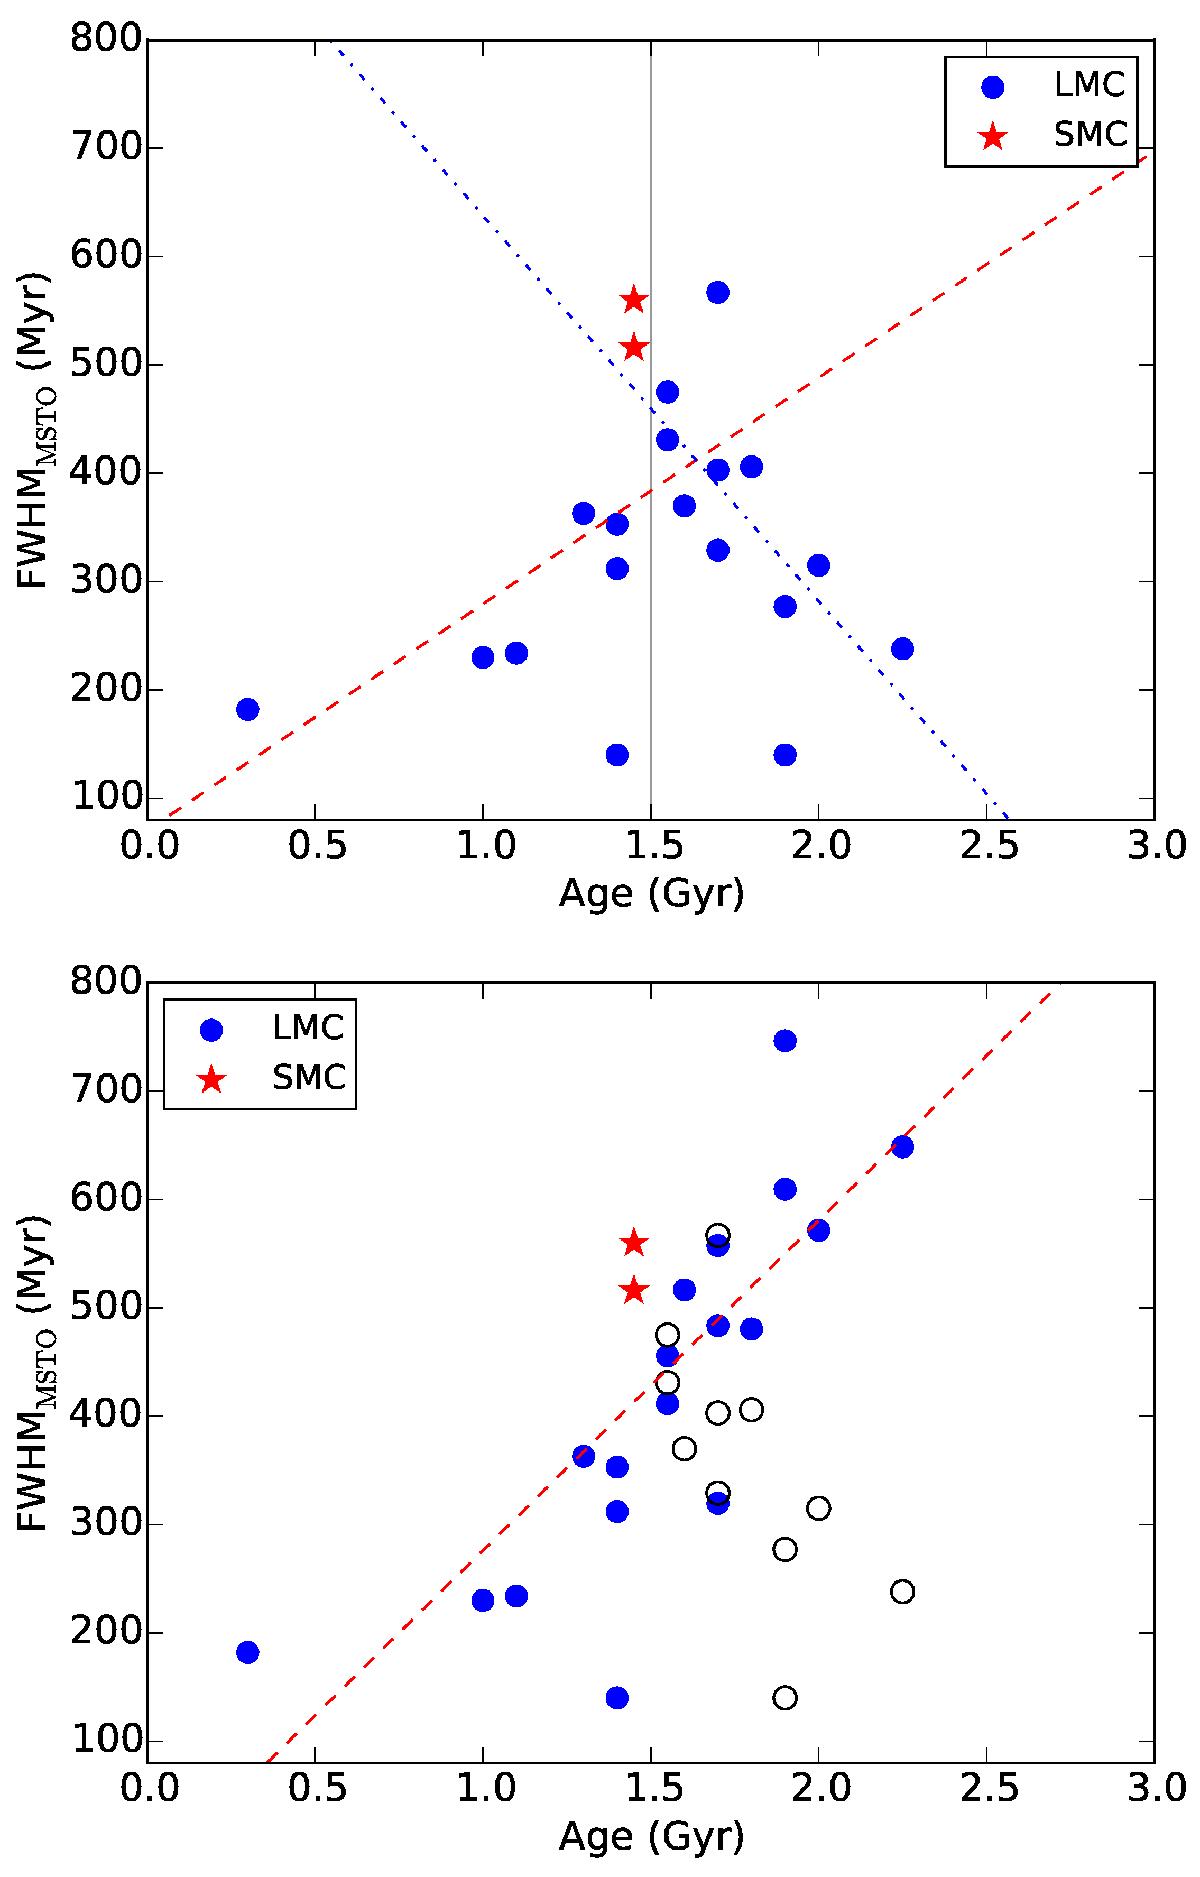
Upper panel: FWHM of the turn-off of clusters in the Goudfrooij et al. (2014) sample as a function of their age. In this plot we also include the 300 Myr-old cluster NGC 1856, which also shows an extended MSTO. Clusters in the LMC are marked with blue circles, whereas the two SMC clusters are denoted with a red asterisk. The width of the MSTO seems to increase with the age of the cluster until an age of 1.5−1.7 Gyr and then decreases again. We divided the plot at 1.5 Gyr (vertical solid gray line) in two parts and performed a linear regression fit to the clusters in the two parts, separately. The fits are indicated by the red dashed line (younger clusters) and the blue dash-dotted line (older clusters). Lower panel: same as the upper panel, but now we mirrored the older clusters at the horizontal plain that goes through the intersection point between the two liner regression fits in the upper panel. We did this to quantify the strength of the correlation of the FWHM with age. The original positions of the clusters are marked with black open circles. The red dashed line is a linear regression fit to the linearized cluster sample.
Current usage metrics show cumulative count of Article Views (full-text article views including HTML views, PDF and ePub downloads, according to the available data) and Abstracts Views on Vision4Press platform.
Data correspond to usage on the plateform after 2015. The current usage metrics is available 48-96 hours after online publication and is updated daily on week days.
Initial download of the metrics may take a while.