Fig. 5
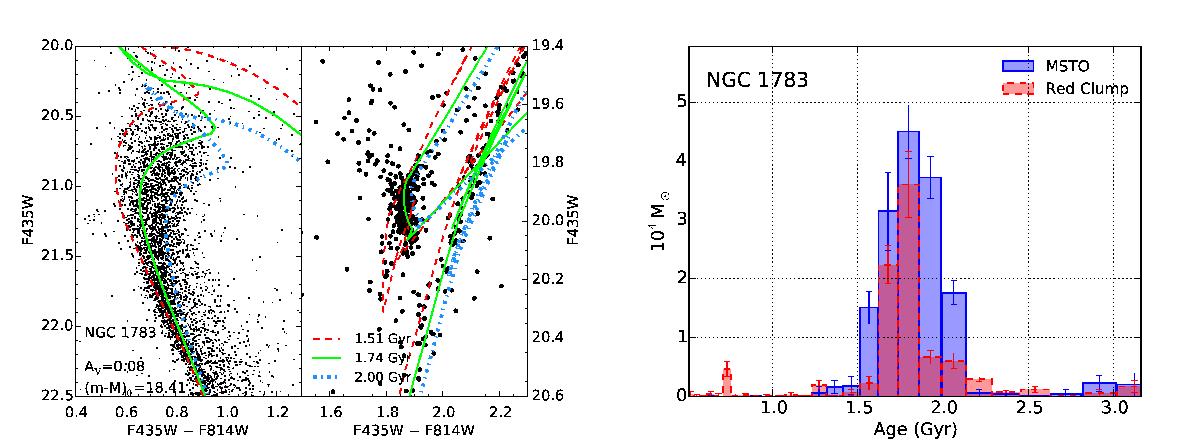
Left panel: CMD of the MSTO and red clump region of NGC 1783 together with overplotted isochrones at three different ages that cover the extent of the MSTO. Right panel: fitted SFH of NGC 1783 using only the MSTO region (blue solid line) and only the red clump region (red dashed line) along with 1σ error bars showing the statistical errors. The error bars result from bootstrapping the data (see text for details).
Current usage metrics show cumulative count of Article Views (full-text article views including HTML views, PDF and ePub downloads, according to the available data) and Abstracts Views on Vision4Press platform.
Data correspond to usage on the plateform after 2015. The current usage metrics is available 48-96 hours after online publication and is updated daily on week days.
Initial download of the metrics may take a while.