Fig. 4
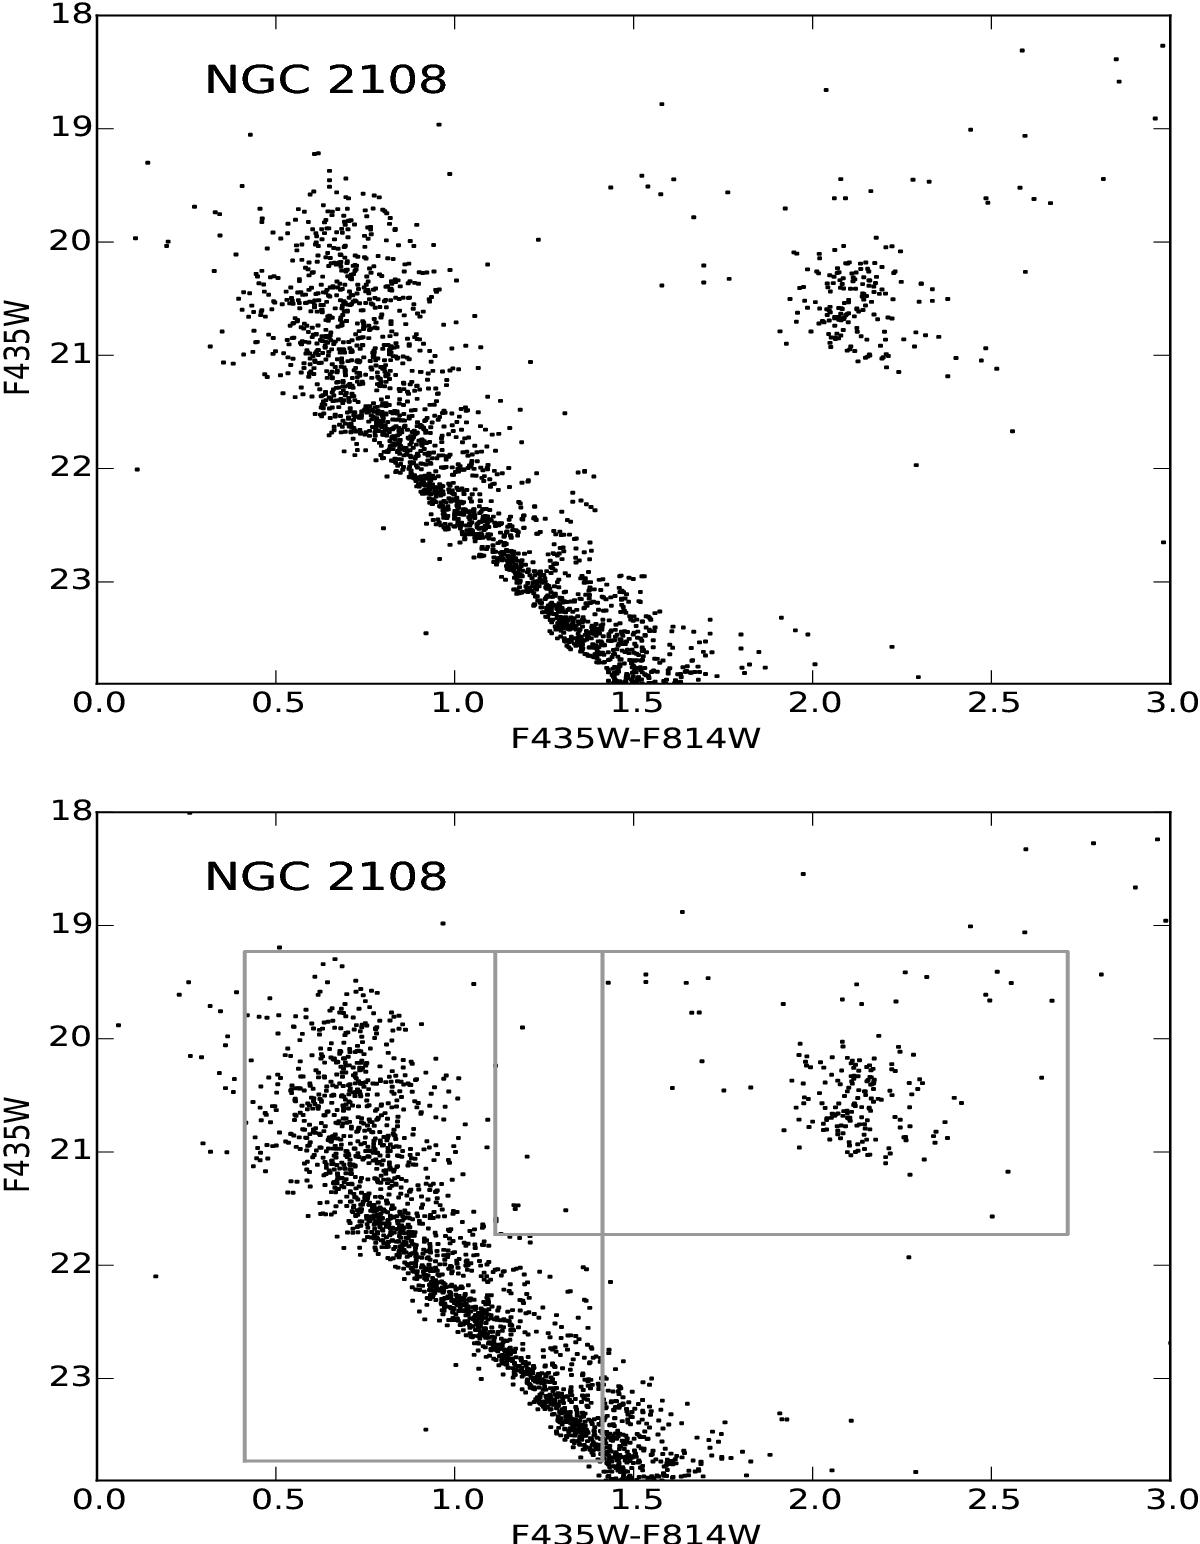
CMDs of NGC 2108 before and after the correction for differential extinction. Upper panel: the original CMD; lower panel: the corrected CMD. The gray boxes show the areas in the CMD used to fit the SFH of the MSTO and the red clump. The limits have been shifted to match the data that has not been corrected for the mean extinction.
Current usage metrics show cumulative count of Article Views (full-text article views including HTML views, PDF and ePub downloads, according to the available data) and Abstracts Views on Vision4Press platform.
Data correspond to usage on the plateform after 2015. The current usage metrics is available 48-96 hours after online publication and is updated daily on week days.
Initial download of the metrics may take a while.