Fig. 4
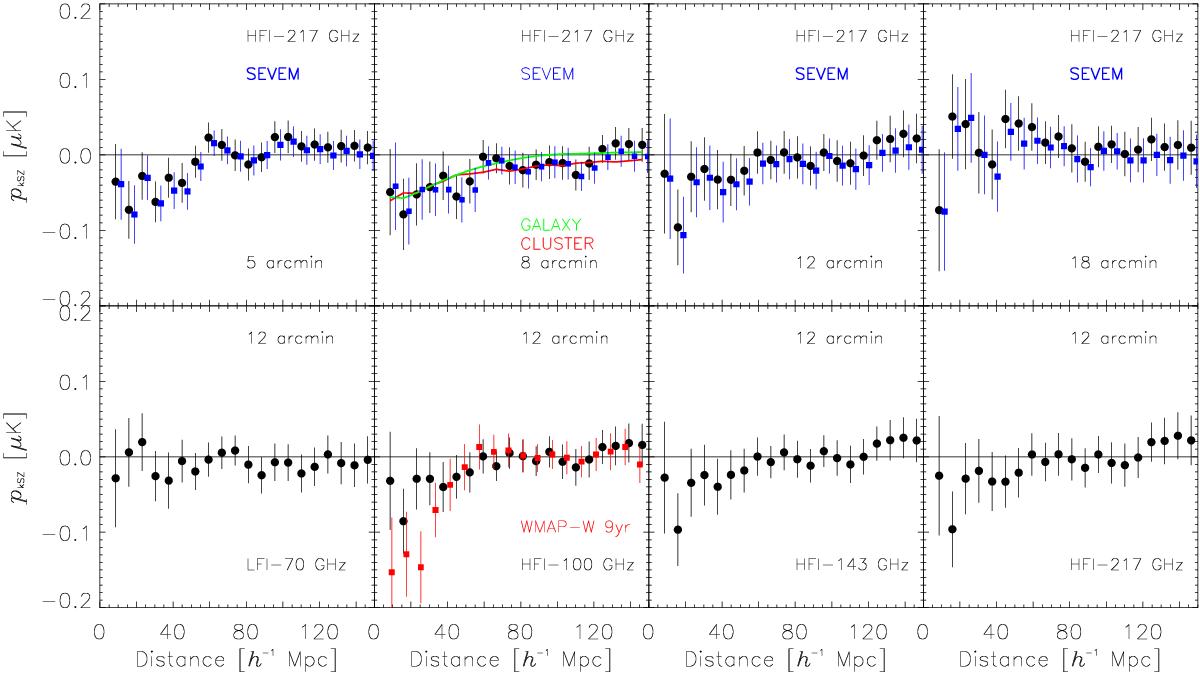
Computation of the kSZ pairwise momentum for the CGC sample. The top row, from left to right, displays the results for different aperture choices on the raw HFI 217 GHz map, namely 5, 8, 12, and 18 arcmin. The top row also shows the analysis for the foreground-cleaned SEVEM map, displayed with blue squares. The fit to the pairwise momentum templates from the CLUSTER catalogue is also displayed by the solid red line, and the GALAXY catalogue by the green line. The bottom row presents the results at a fixed aperture of 12 arcmin for different frequency maps, including WMAP-9 W-band data (red squares).
Current usage metrics show cumulative count of Article Views (full-text article views including HTML views, PDF and ePub downloads, according to the available data) and Abstracts Views on Vision4Press platform.
Data correspond to usage on the plateform after 2015. The current usage metrics is available 48-96 hours after online publication and is updated daily on week days.
Initial download of the metrics may take a while.