Fig. 3
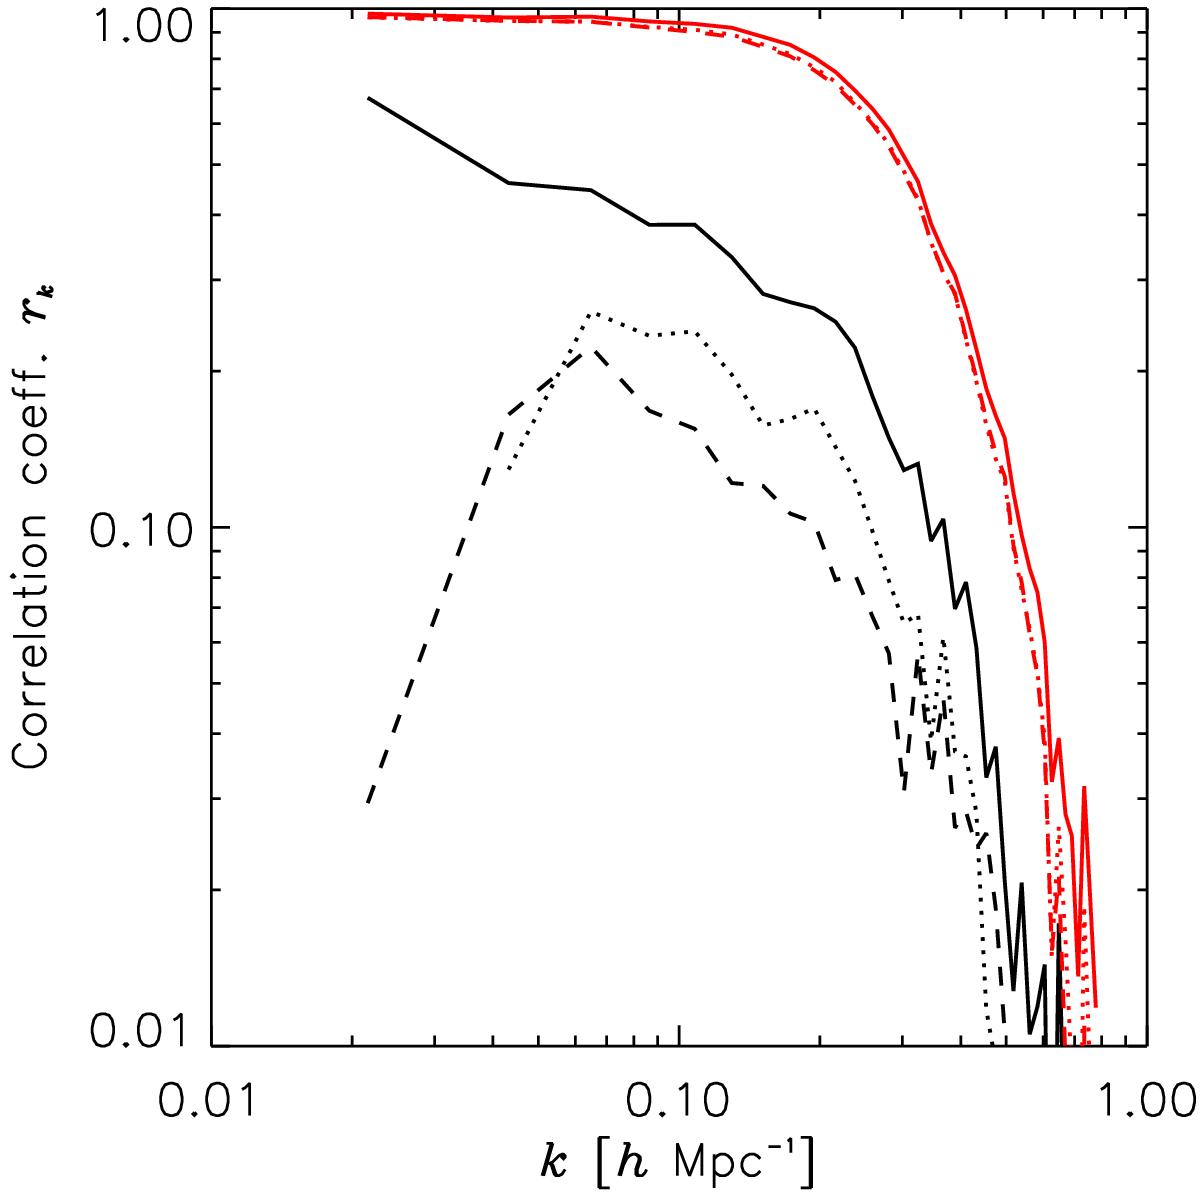
Correlation coefficient of the recovered line-of-sight velocities with the actual ones in our GALAXY mock catalogue. Solid, dotted, and dashed lines refer to the LINEAR, LOG-LINEAR, and LOG-2LPT approaches, respectively. The red lines consider the ideal scenario without any sky mask or selection function, while the black ones are for the same sky mask and selection function present in the real CGC.
Current usage metrics show cumulative count of Article Views (full-text article views including HTML views, PDF and ePub downloads, according to the available data) and Abstracts Views on Vision4Press platform.
Data correspond to usage on the plateform after 2015. The current usage metrics is available 48-96 hours after online publication and is updated daily on week days.
Initial download of the metrics may take a while.