Fig. A.1
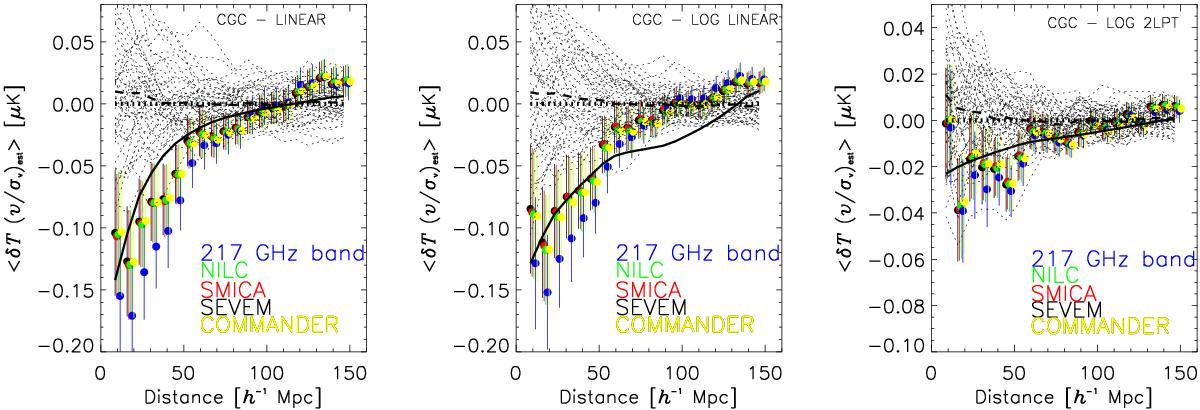
Measured cross-correlation function between the kSZ temperature estimates and the recovered radial peculiar velocities, ![]() , according to the three adopted approaches, LINEAR (left panel), LOG-LINEAR (middle panel), and LOG-2LPT (right panel). The velocities are normalized with their rms dispersion σv = 230, 310, and 200 km s-1from left to right, respectively. We use an aperture of 8 arcmin when estimating kSZ temperature fluctuations. Filled coloured circles correspond to
, according to the three adopted approaches, LINEAR (left panel), LOG-LINEAR (middle panel), and LOG-2LPT (right panel). The velocities are normalized with their rms dispersion σv = 230, 310, and 200 km s-1from left to right, respectively. We use an aperture of 8 arcmin when estimating kSZ temperature fluctuations. Filled coloured circles correspond to ![]() estimates from different CMB maps (SEVEM, SMICA, NILC, COMMANDER, and the HFI 217 GHz map). The dotted lines display the null estimates obtained after computing kSZ temperature estimates for rotated positions on the SEVEM map, and the thick dashed line displays the average of the dotted lines. Error bars are computed from these null estimates of the correlation function. The solid line provides the best fit to the data of the theoretical prediction for
estimates from different CMB maps (SEVEM, SMICA, NILC, COMMANDER, and the HFI 217 GHz map). The dotted lines display the null estimates obtained after computing kSZ temperature estimates for rotated positions on the SEVEM map, and the thick dashed line displays the average of the dotted lines. Error bars are computed from these null estimates of the correlation function. The solid line provides the best fit to the data of the theoretical prediction for ![]() obtained from the GALAXY mock catalogue. These predictions are obtained using only a relatively small number of mock halos, and hence their uncertainty must be considered when comparing to data.
obtained from the GALAXY mock catalogue. These predictions are obtained using only a relatively small number of mock halos, and hence their uncertainty must be considered when comparing to data.
Current usage metrics show cumulative count of Article Views (full-text article views including HTML views, PDF and ePub downloads, according to the available data) and Abstracts Views on Vision4Press platform.
Data correspond to usage on the plateform after 2015. The current usage metrics is available 48-96 hours after online publication and is updated daily on week days.
Initial download of the metrics may take a while.