Free Access
Fig. 4
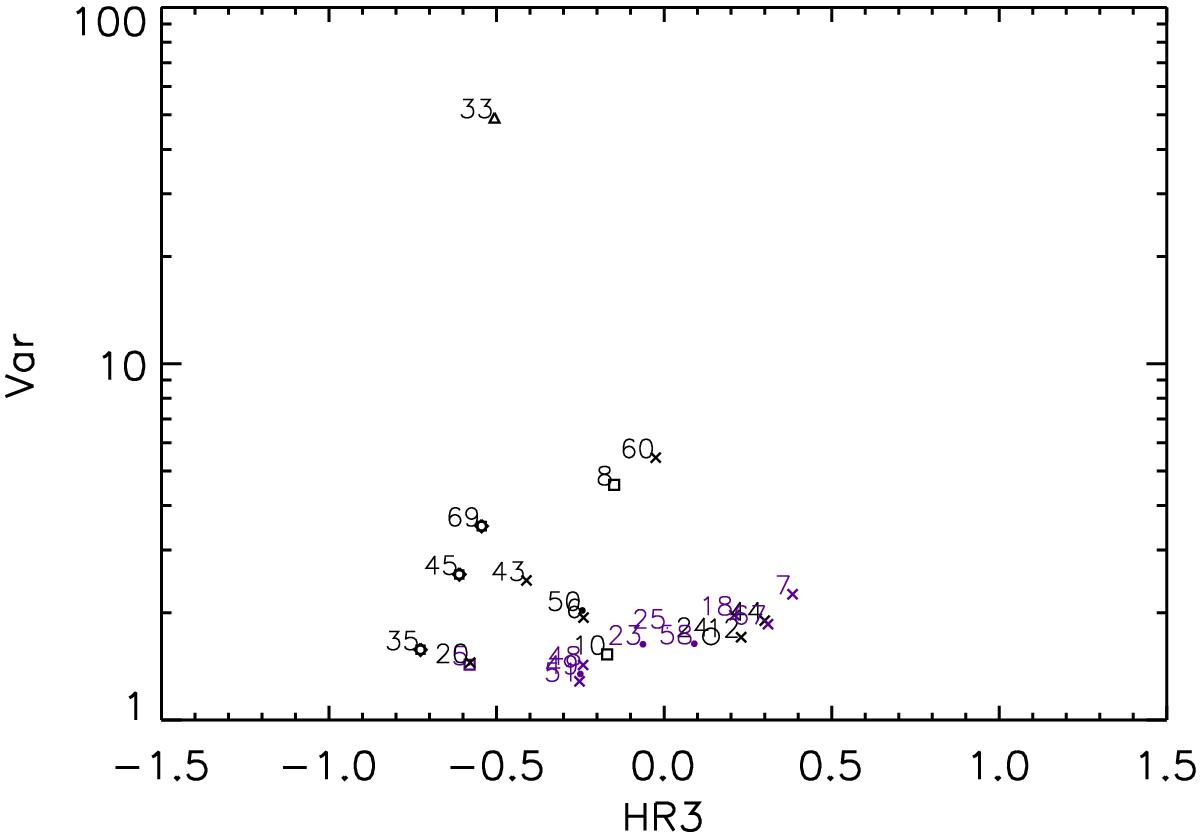
Variability factor of sources in the 0.2 − 4.5 keV band plotted versus HR3. Sources with a statistical significance of variability below 3 are marked in violet. For the different source classes the same symbol types are used as in Fig. 2.
Current usage metrics show cumulative count of Article Views (full-text article views including HTML views, PDF and ePub downloads, according to the available data) and Abstracts Views on Vision4Press platform.
Data correspond to usage on the plateform after 2015. The current usage metrics is available 48-96 hours after online publication and is updated daily on week days.
Initial download of the metrics may take a while.