Fig. 9
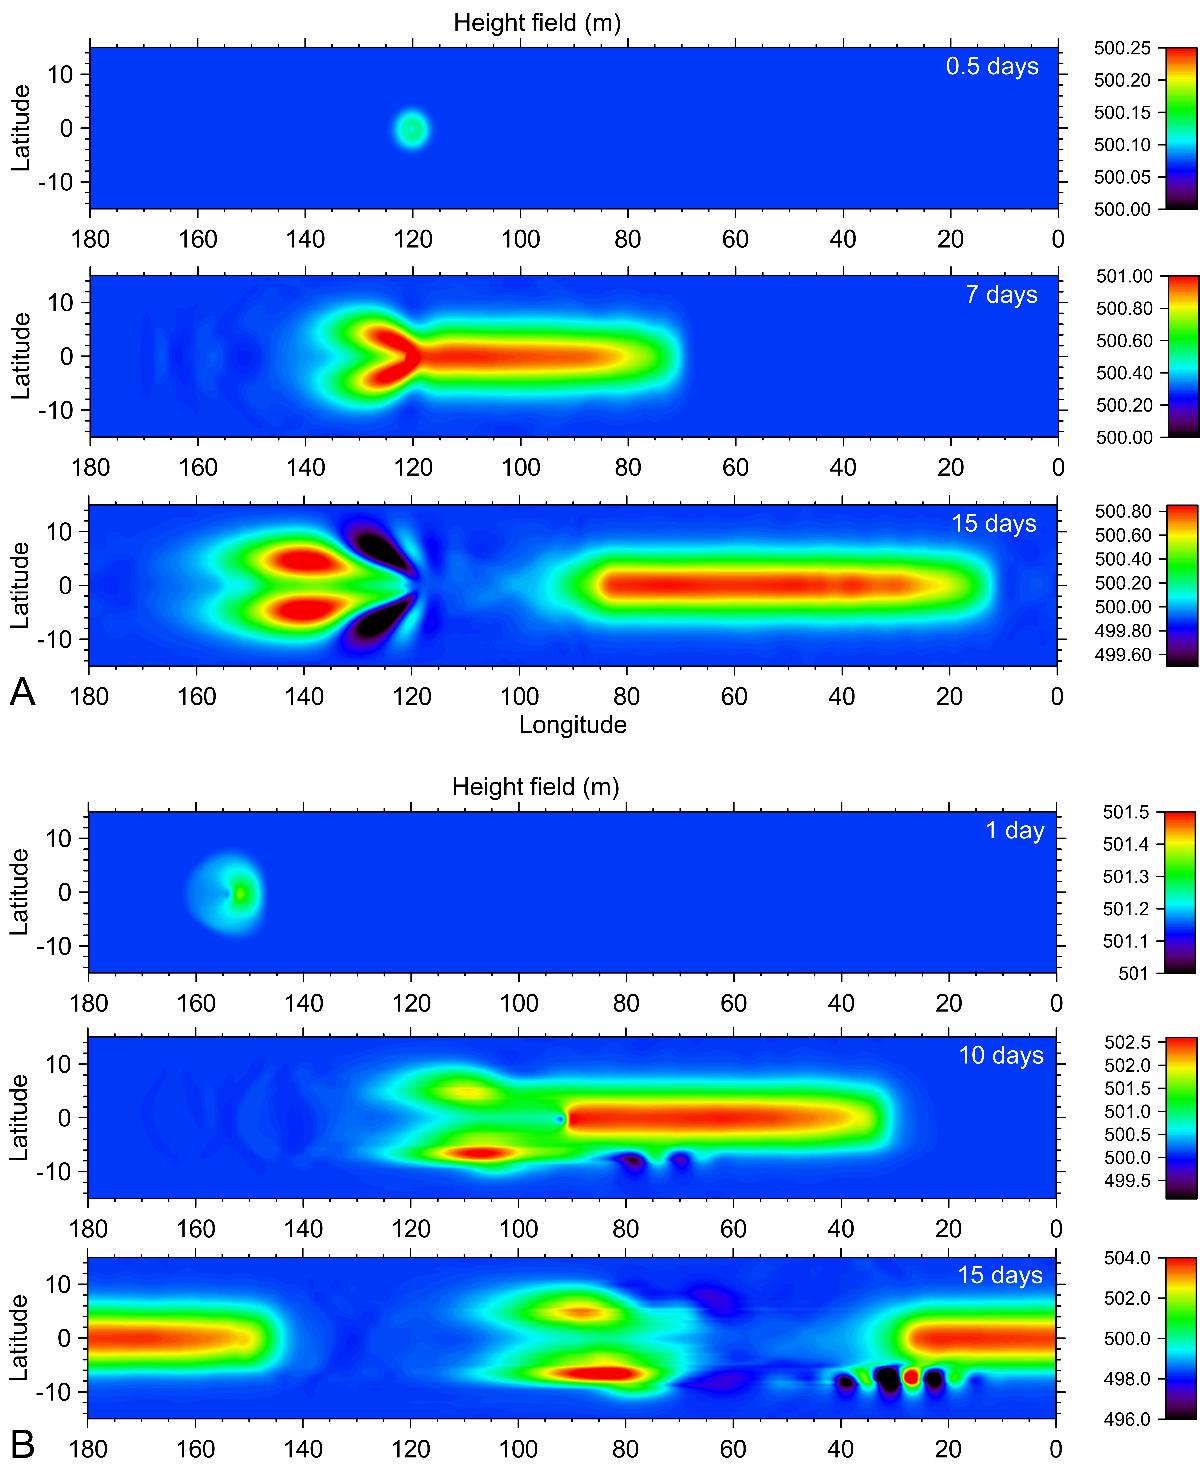
A) Surface topography map of one-layer SW simulations at the equatorial region under Jovian conditions when zonal winds are turned off and disturbance amplitude is 3 m and LE = 5000 km. A pair of Rossby–Kelvin wave forms resembling the Matsuno-Gill model. From the point of view of the injected pulse, Rossby waves (double symmetric lobe at left) drift to the west,while the Kelvin wave (large bar at right) moves to the east (cK = 108 m s-1). B) Surface topography map for the same conditions as in panel A) (LE and initial perturbation amplitude), when zonal winds are switched on. In this case cK = 187 m s-1, which is very close to the sum of background zonal wind speed and theoretical velocity phase for the Kelvin wave.
Current usage metrics show cumulative count of Article Views (full-text article views including HTML views, PDF and ePub downloads, according to the available data) and Abstracts Views on Vision4Press platform.
Data correspond to usage on the plateform after 2015. The current usage metrics is available 48-96 hours after online publication and is updated daily on week days.
Initial download of the metrics may take a while.