Free Access
Fig. 8
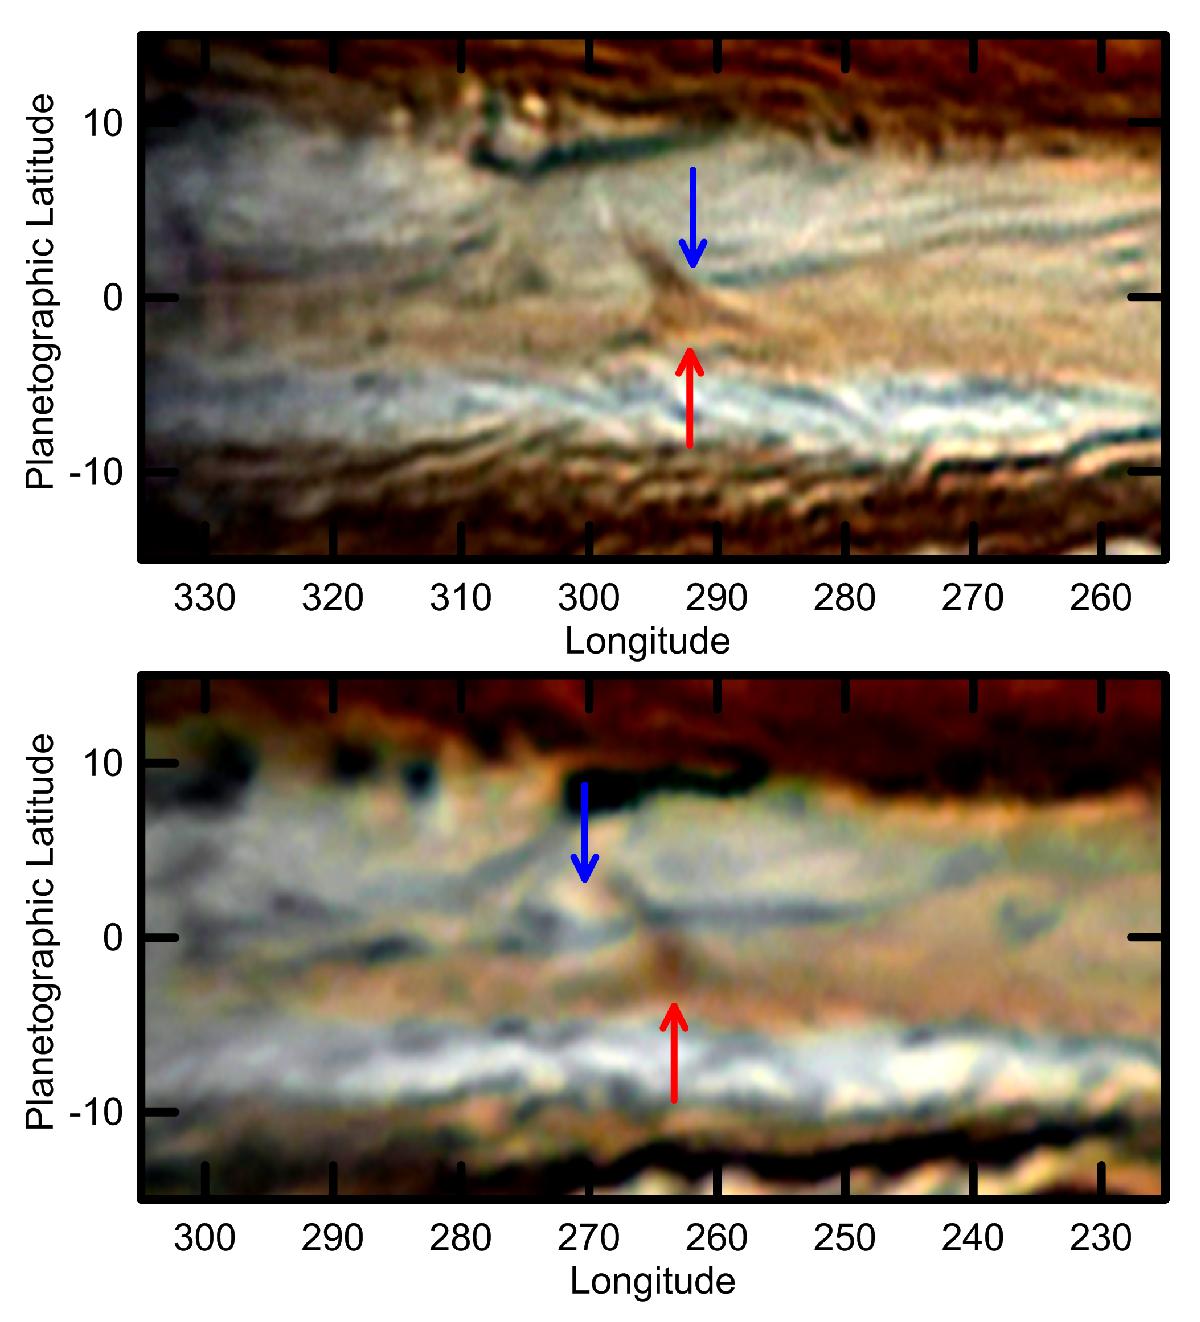
A pair of RGB image composites in October 29 (top) and November 3 (bottom) showing the apparent motion of feature Y1 (indicated with a red arrow) over a background linear cloud (indicated with a blue arrow).
Current usage metrics show cumulative count of Article Views (full-text article views including HTML views, PDF and ePub downloads, according to the available data) and Abstracts Views on Vision4Press platform.
Data correspond to usage on the plateform after 2015. The current usage metrics is available 48-96 hours after online publication and is updated daily on week days.
Initial download of the metrics may take a while.