Fig. 7
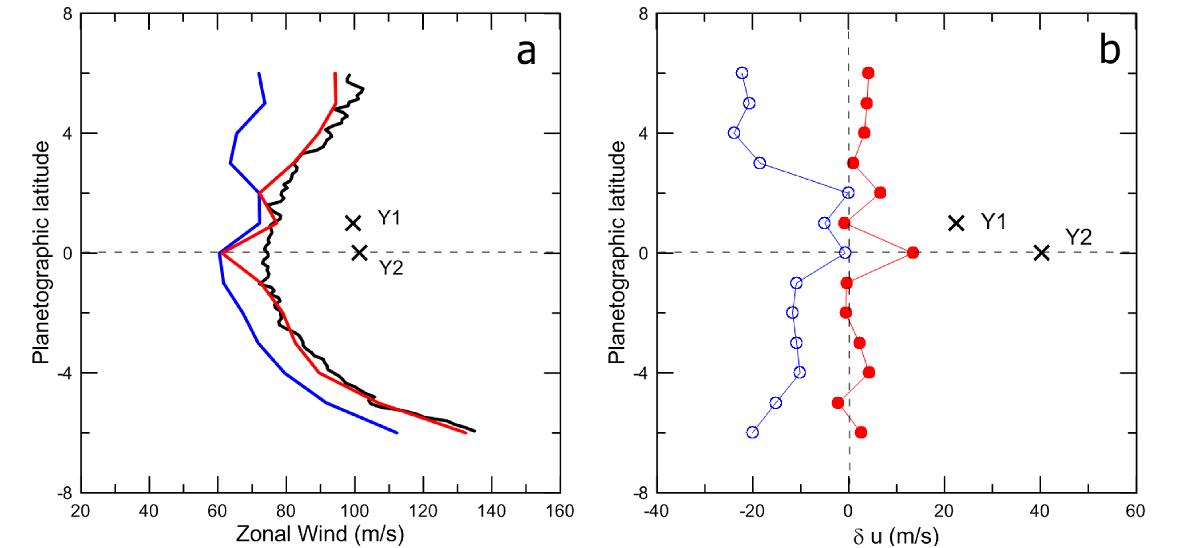
Features velocities: a) zonal wind profiles HST data in September 2012 at two wavelengths: 763 nm (red line) and at 275 nm (blue line). The black line is a reference profile from García-Melendo & Sánchez-Lavega (2001). The × are the measured speed of Y1 and Y2; b) differences in velocity between profiles. Blue line and dots: HST profile at 275 nm minus HST profile at 763 nm (indicates vertical wind shear); red line and dots: García-Melendo & Sánchez-Lavega (2001) profile minus HST 763 nm profile (indicates long-term behaviour); the cross (×) represents the velocity difference between Y1 and Y2 relative to the 763 nm profile at their latitudes (which suggests wave phase speed for Y features).
Current usage metrics show cumulative count of Article Views (full-text article views including HTML views, PDF and ePub downloads, according to the available data) and Abstracts Views on Vision4Press platform.
Data correspond to usage on the plateform after 2015. The current usage metrics is available 48-96 hours after online publication and is updated daily on week days.
Initial download of the metrics may take a while.