Free Access
Fig. 5
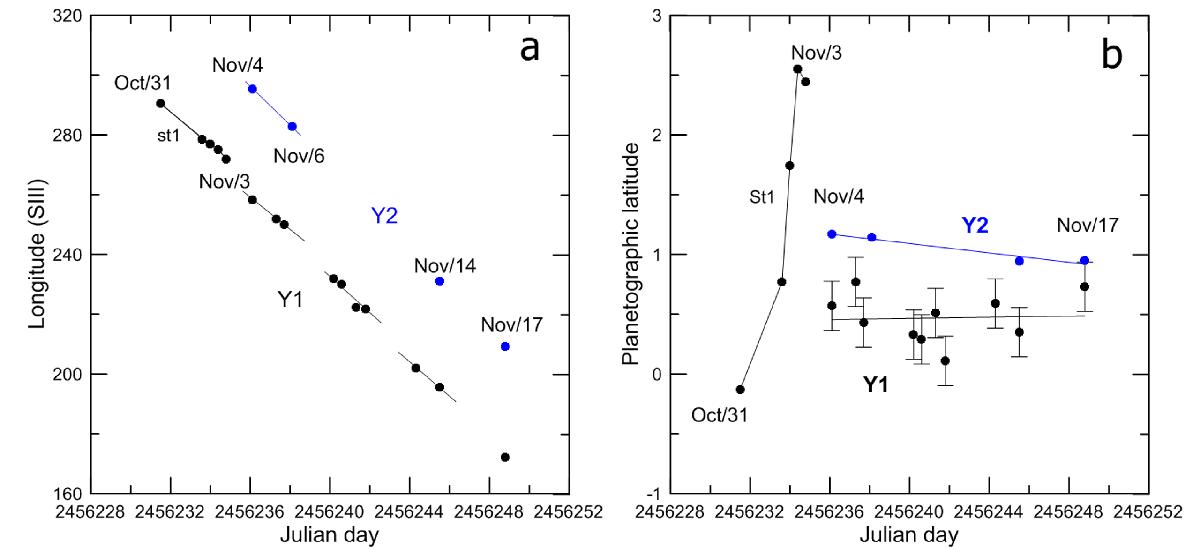
Motions of bright spots related to Y1 and Y2 features in October and November 2012: a) drift in System III Longitude; b) latitude changes. The lines are linear fits to the measured data for tracked clouds. Bright feature St1 is indicated.
Current usage metrics show cumulative count of Article Views (full-text article views including HTML views, PDF and ePub downloads, according to the available data) and Abstracts Views on Vision4Press platform.
Data correspond to usage on the plateform after 2015. The current usage metrics is available 48-96 hours after online publication and is updated daily on week days.
Initial download of the metrics may take a while.