Free Access
Fig. 4
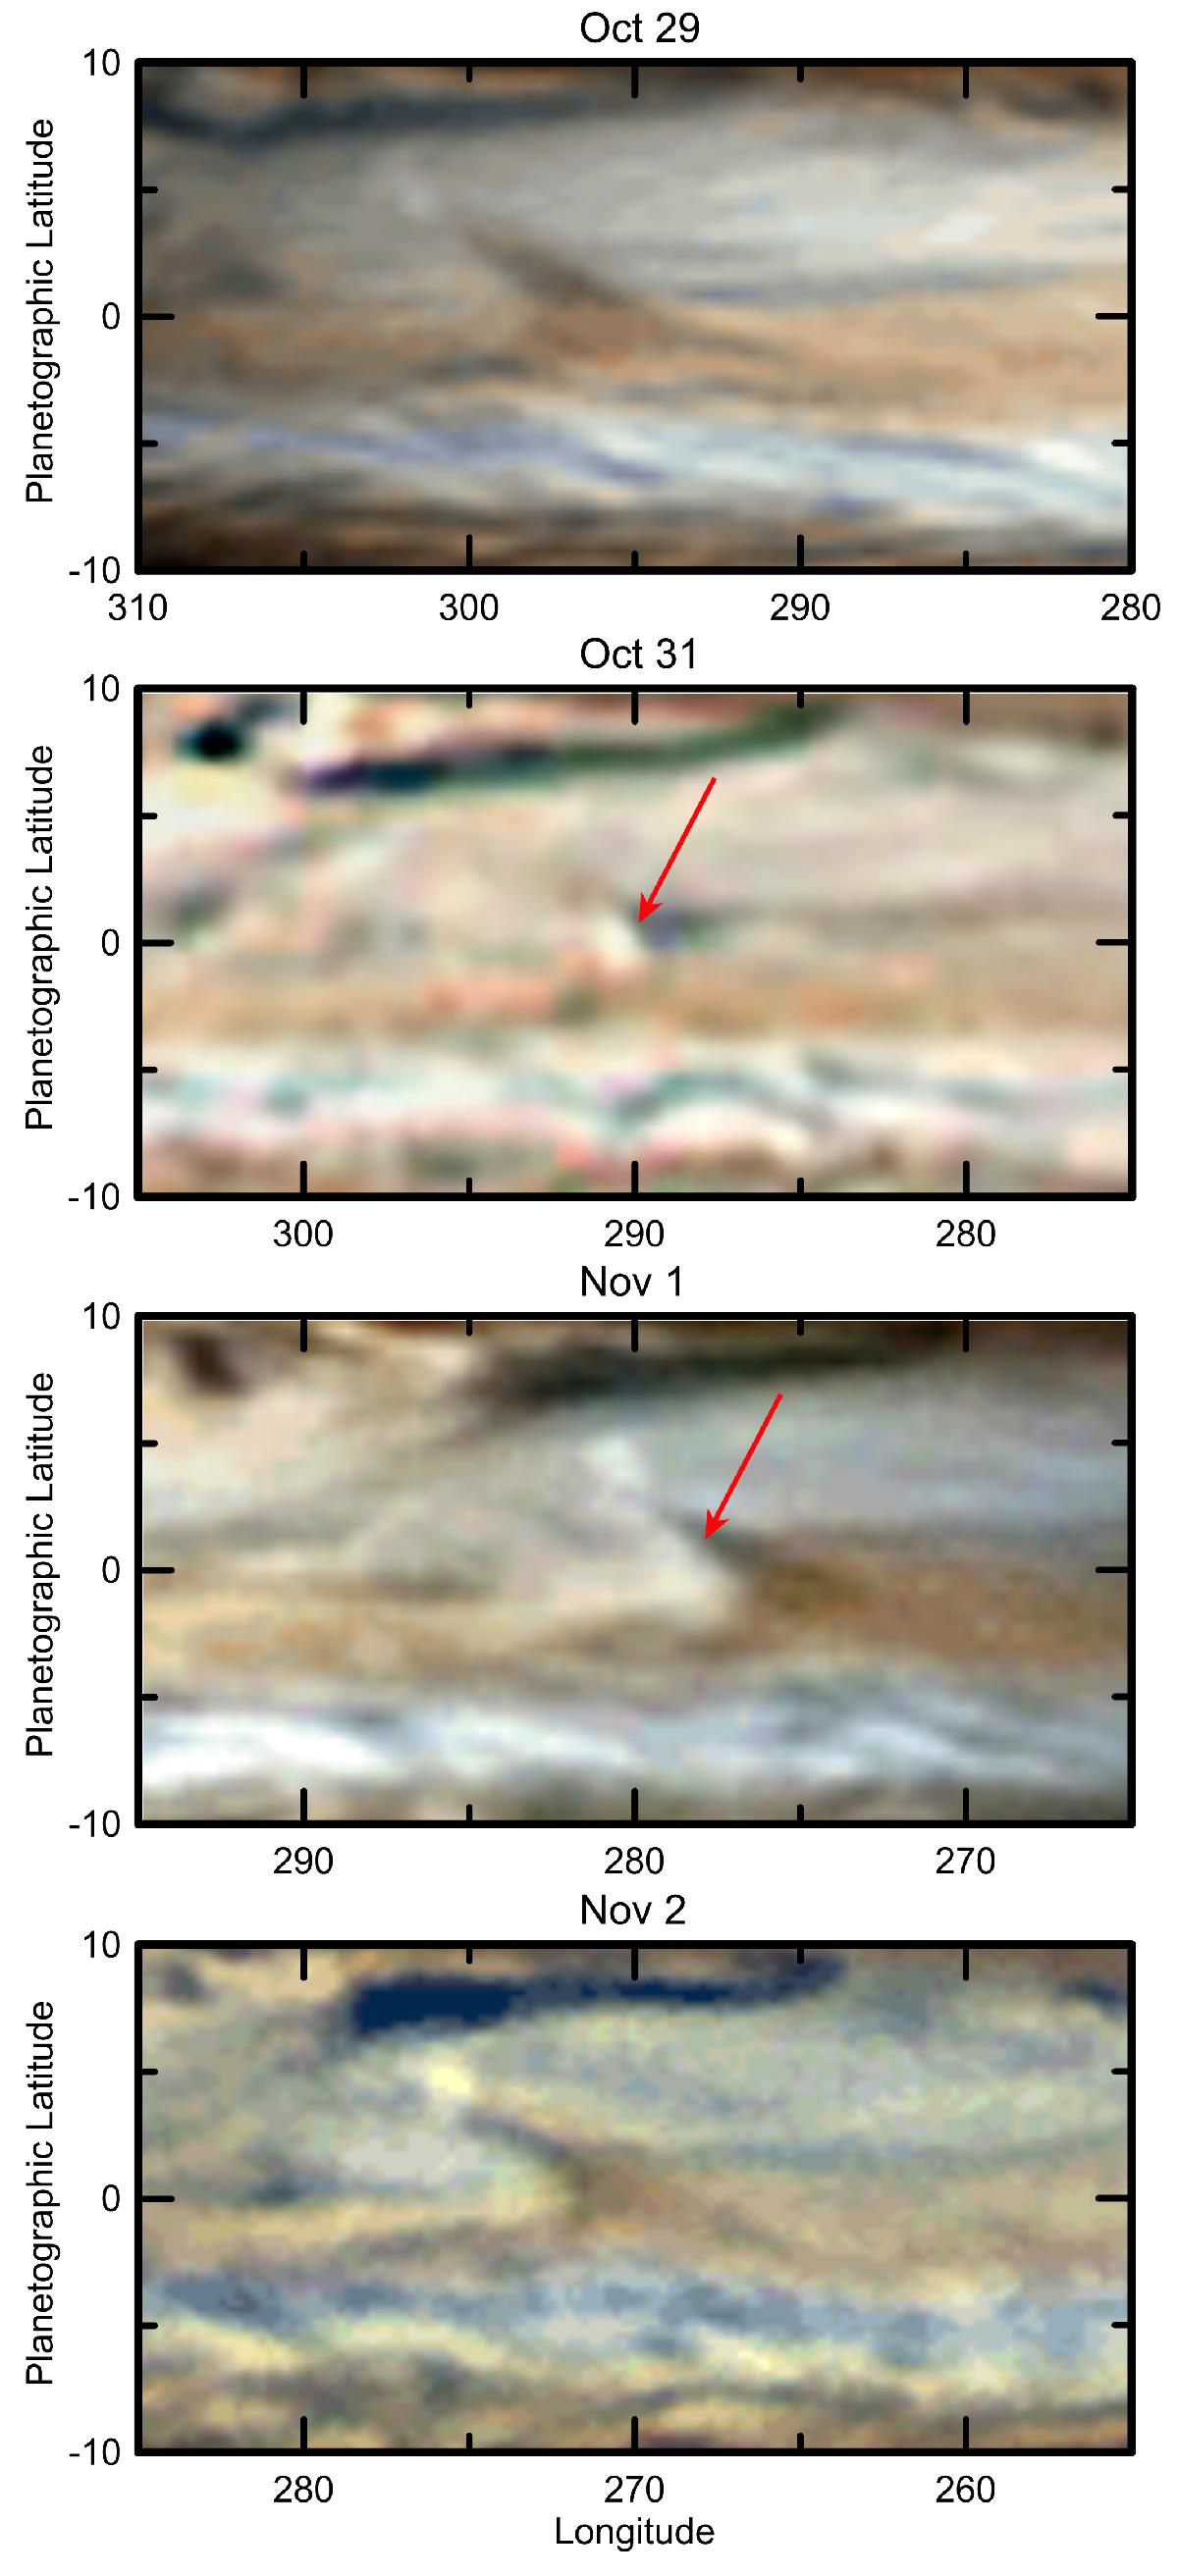
Maps at the indicated dates in 2012 showing rapid changes related to bright clouds (indicated by red arrows) at the centre of the “V” vertex of the Y features. Image authors from top to bottom: C. Go, J. J. Poupeau, T. Akutsu, and F. Willems.
Current usage metrics show cumulative count of Article Views (full-text article views including HTML views, PDF and ePub downloads, according to the available data) and Abstracts Views on Vision4Press platform.
Data correspond to usage on the plateform after 2015. The current usage metrics is available 48-96 hours after online publication and is updated daily on week days.
Initial download of the metrics may take a while.