Fig. 2
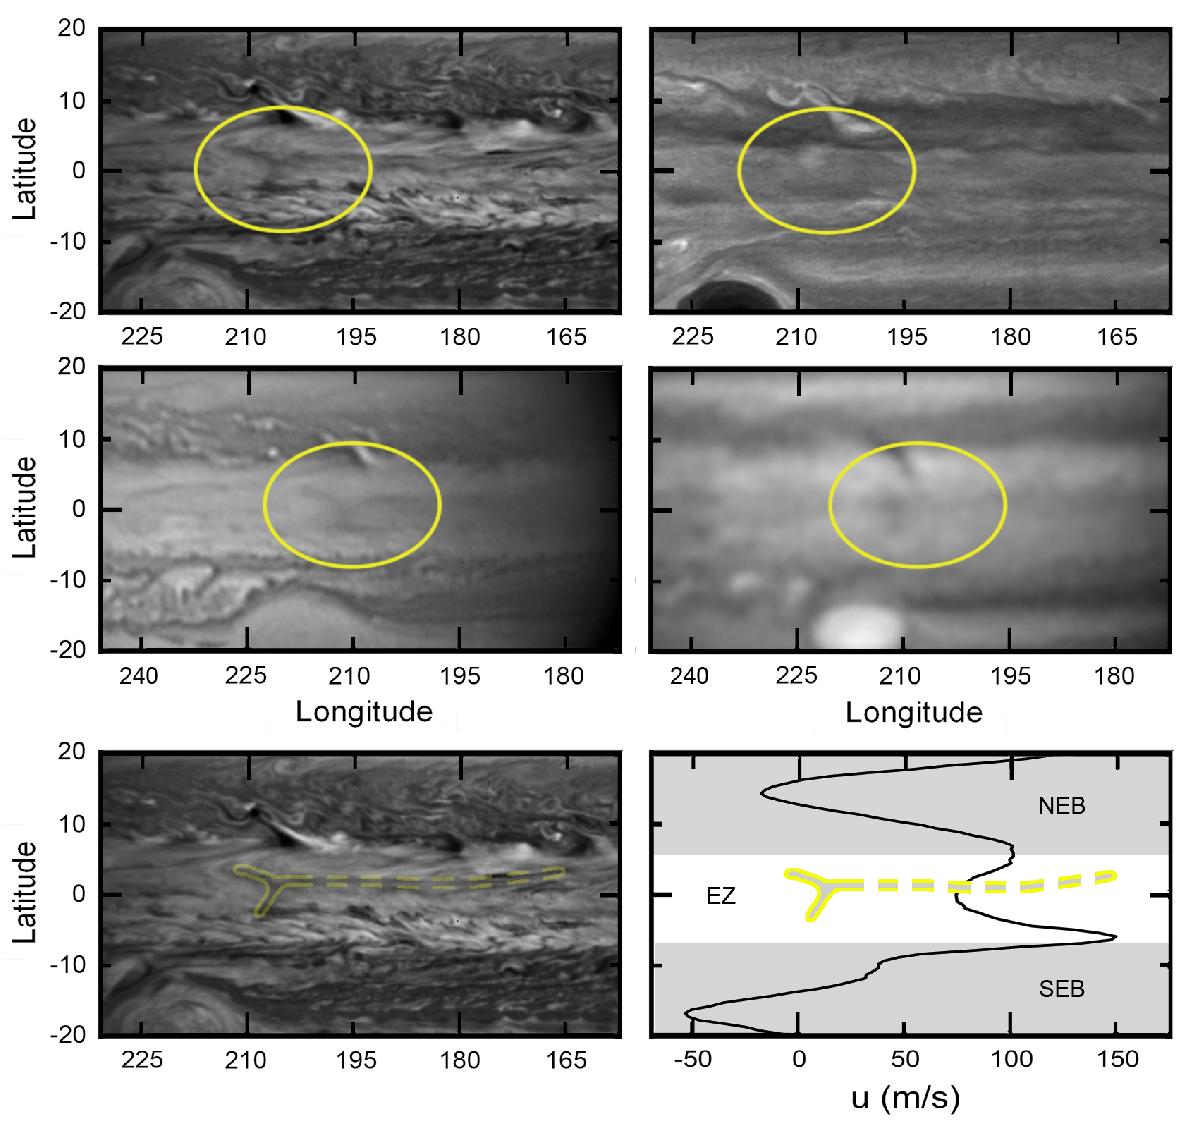
Y-like feature’s morphology. Top panels show two HST images (September 20th) taken the same day but in two distinct filters; the left image was taken with a NIR (F763M) filter while the right image is observed by an UV (F275W) filter. Middle panels show two images from the IOPW database by the same observer (D. Peach) taken on September 19th, left one in RGB and in methane absorption band the one on the right. In the bottom panel there is a cartoon representing where the Y-like feature is and where in the wind profile is it located. The Wind profile represented is the García-Melendo & Sánchez-Lavega (2001) one (NEB: north equatorial Belt, EZ: equatorial zone and SEB: south equatorial belt).
Current usage metrics show cumulative count of Article Views (full-text article views including HTML views, PDF and ePub downloads, according to the available data) and Abstracts Views on Vision4Press platform.
Data correspond to usage on the plateform after 2015. The current usage metrics is available 48-96 hours after online publication and is updated daily on week days.
Initial download of the metrics may take a while.