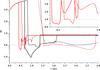
Fig. 8
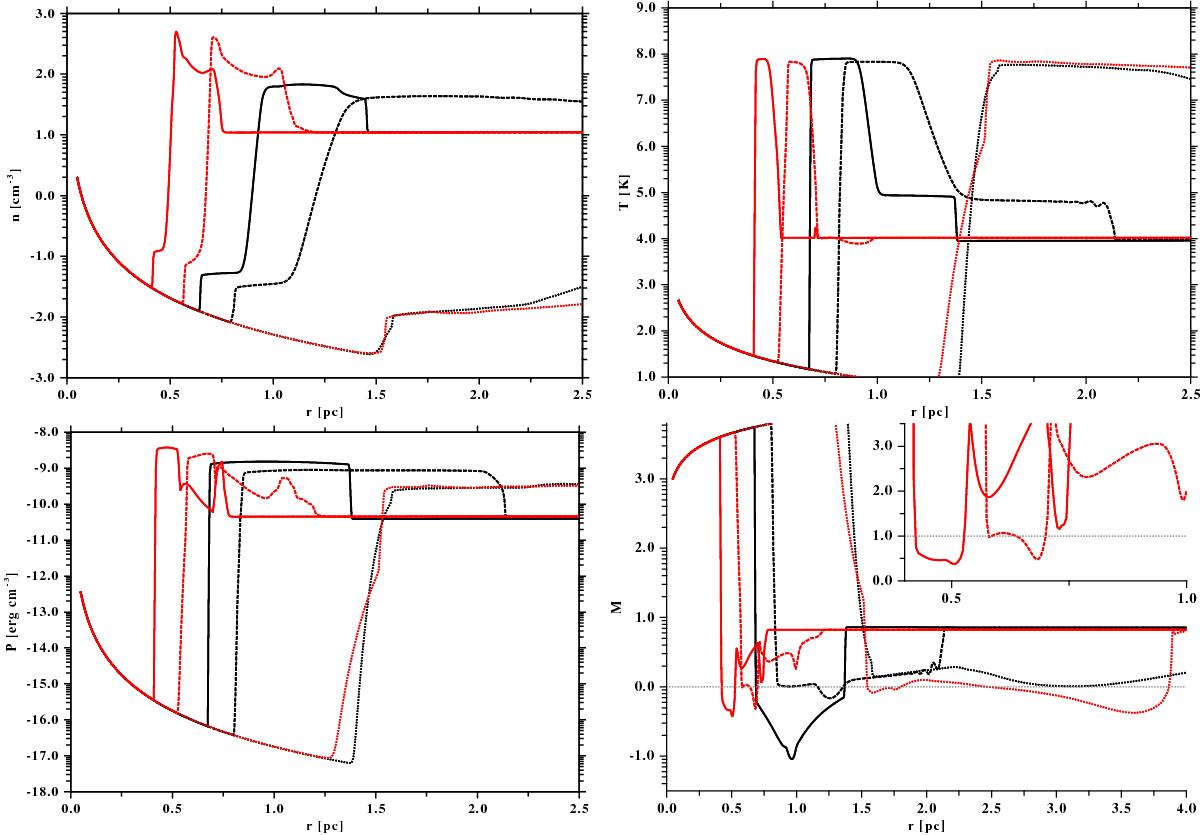
Number density, temperature, thermal pressure, and the Mach number. The black lines describe them for the model without and the red lines the parameters for the model with cooling and heating. The solid lines show the parameters along the stagnation line (i.e. 0°), while the dashed lines are those along the pole (90°), and the dotted lines along the tail direction (180°). The upper left panel shows that the number density for the model without cooling and heating jumps at the TS and BS by a factor of four, while for the CH-model the density at the TS also increases by a factor of four, but at the BS it increases by more than a factor of 10. In both cases the temperature jumps by orders of magnitudes at the shocks (upper right panel). The lower left panel shows the thermal pressure, which is discontinuous at the shocks, but in both cases more or less continuous at the AP along the stagnation line. The lower right panel shows the Mach number. The inlet is a linear plot in the Mach number between 0 and 3. It shows only the Mach numbers in the CH-model to present its structure. The CH-model is presented after 150 kyr, while the pH model is fully developed (kyr).
Current usage metrics show cumulative count of Article Views (full-text article views including HTML views, PDF and ePub downloads, according to the available data) and Abstracts Views on Vision4Press platform.
Data correspond to usage on the plateform after 2015. The current usage metrics is available 48-96 hours after online publication and is updated daily on week days.
Initial download of the metrics may take a while.