Free Access
Fig. 2
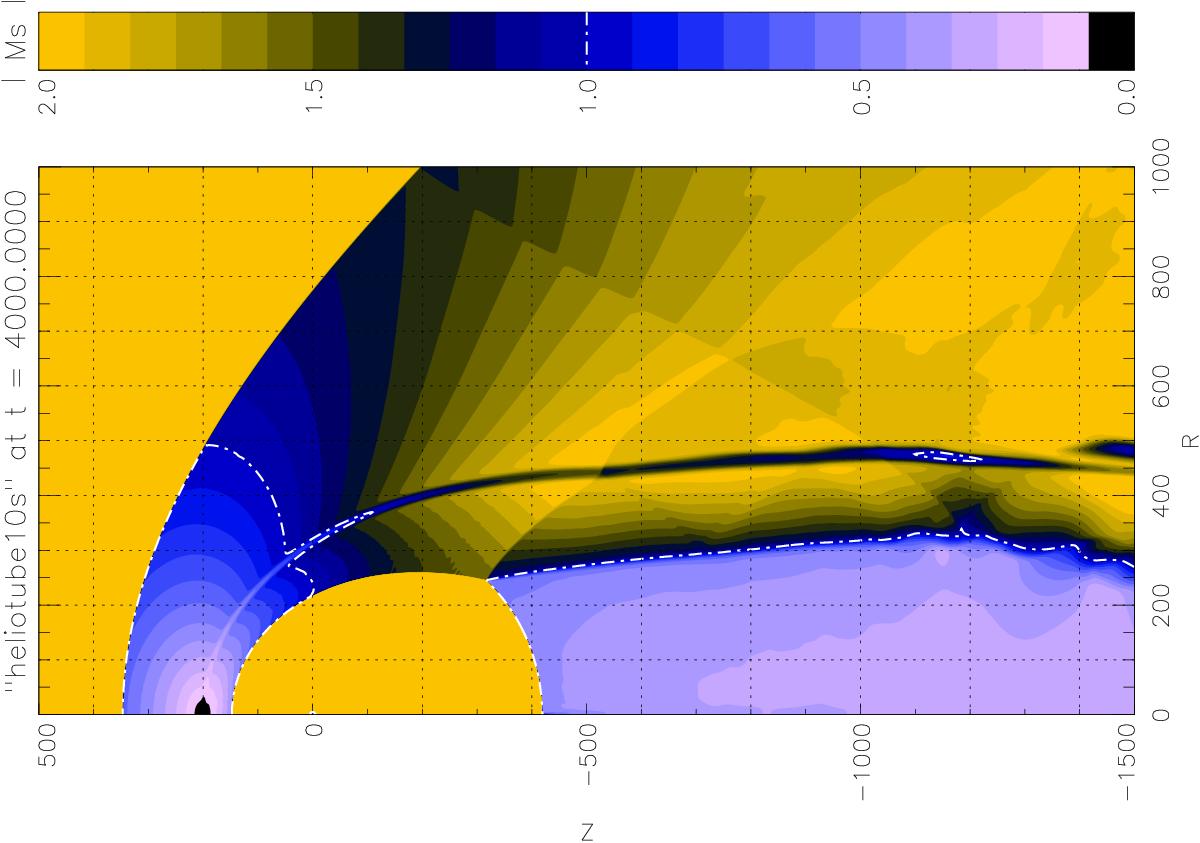
Contour plot of the sonic Mach number M from an polytropic one-fluid simulation. The features described in the text and shown in Fig. 1 can easily be recognized. The kink at x = −250, and R = 1000 is caused by a reflection at the boundary of the integration region. Values are truncated at M = 2.
Current usage metrics show cumulative count of Article Views (full-text article views including HTML views, PDF and ePub downloads, according to the available data) and Abstracts Views on Vision4Press platform.
Data correspond to usage on the plateform after 2015. The current usage metrics is available 48-96 hours after online publication and is updated daily on week days.
Initial download of the metrics may take a while.