Free Access
Fig. 10
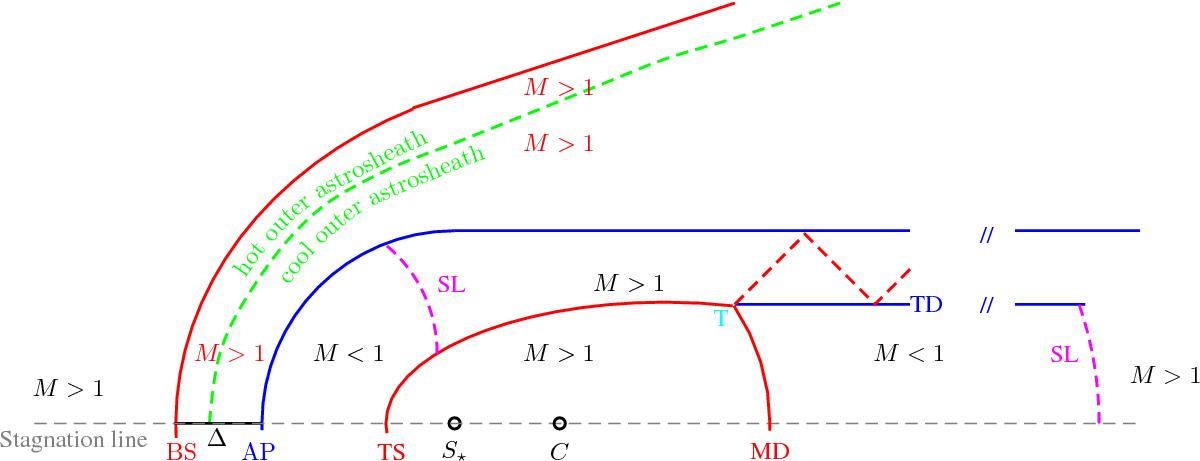
Sketch of an astrosphere with strong cooling and heating effects. The sonic lines are different from those in Fig. 1, and in some region the Mach number has changed. The boundary between the hot and cool outer astrosheath is marked with a dashed green line. The changes in the Mach number are indicated in red.
Current usage metrics show cumulative count of Article Views (full-text article views including HTML views, PDF and ePub downloads, according to the available data) and Abstracts Views on Vision4Press platform.
Data correspond to usage on the plateform after 2015. The current usage metrics is available 48-96 hours after online publication and is updated daily on week days.
Initial download of the metrics may take a while.