Fig. 7
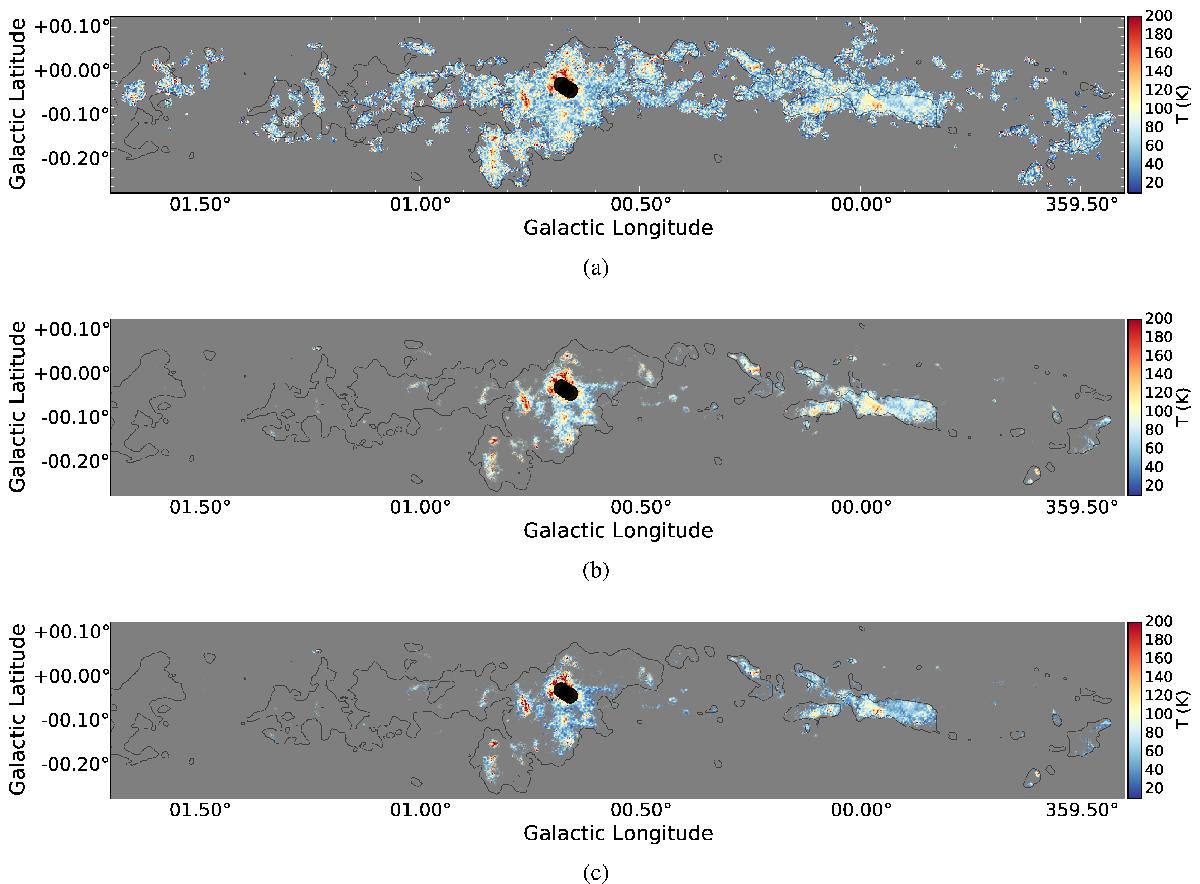
Temperature maps assuming fixed Xp - H2CO = 1.2 × 10⁻⁹ and n(H2). The maps in b) and c) are masked by signal-to-noise such that regions that have lower signal-to-noise are more gray. The thin black contours are at a column N(H2) = 5 × 1022 cm-2 from the Herschel SED fit maps. a)n(H2) = 104 cm-3, no mask; b) n(H2) = 104 cm-3; c) n(H2) = 105 cm-3.
Current usage metrics show cumulative count of Article Views (full-text article views including HTML views, PDF and ePub downloads, according to the available data) and Abstracts Views on Vision4Press platform.
Data correspond to usage on the plateform after 2015. The current usage metrics is available 48-96 hours after online publication and is updated daily on week days.
Initial download of the metrics may take a while.