Fig. E.3
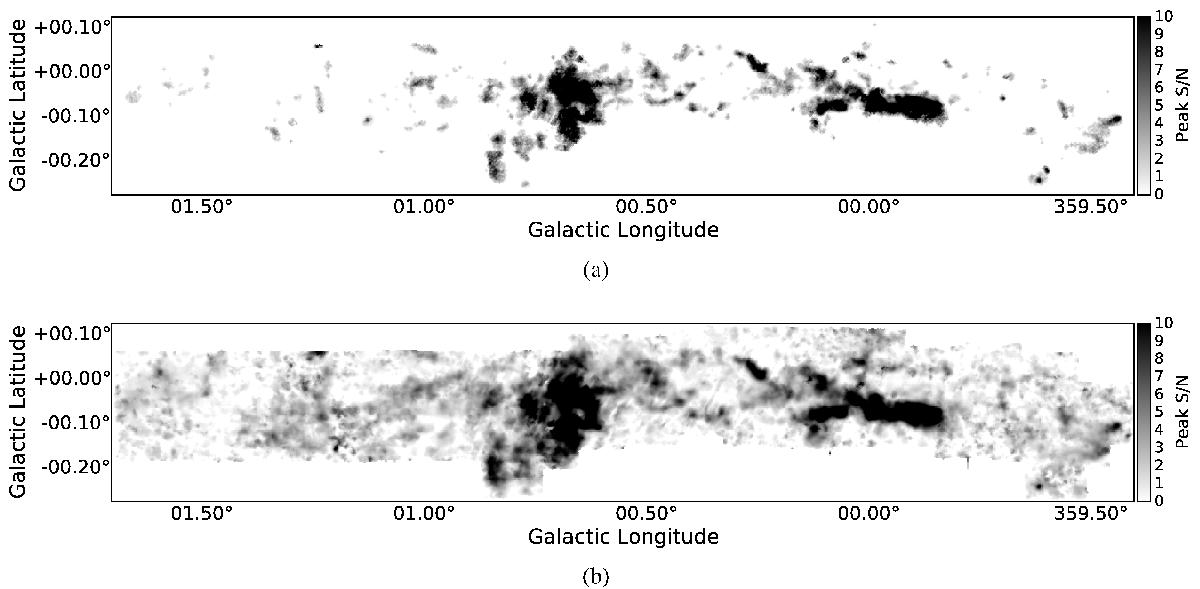
Map of the peak signal-to-noise in the p - H2CO30,3−20,2 line with no smoothing (top) and with 33.84′′ smoothing (bottom). These maps give an indication of the reliability of the temperatures extracted in Fig. E.2. The colorbars are intentionally saturated at S/N> 10 since above this threshold, the temperatures are reliable as long as they are in the TG< 150 K regime.
Current usage metrics show cumulative count of Article Views (full-text article views including HTML views, PDF and ePub downloads, according to the available data) and Abstracts Views on Vision4Press platform.
Data correspond to usage on the plateform after 2015. The current usage metrics is available 48-96 hours after online publication and is updated daily on week days.
Initial download of the metrics may take a while.