Free Access
Fig. D.5
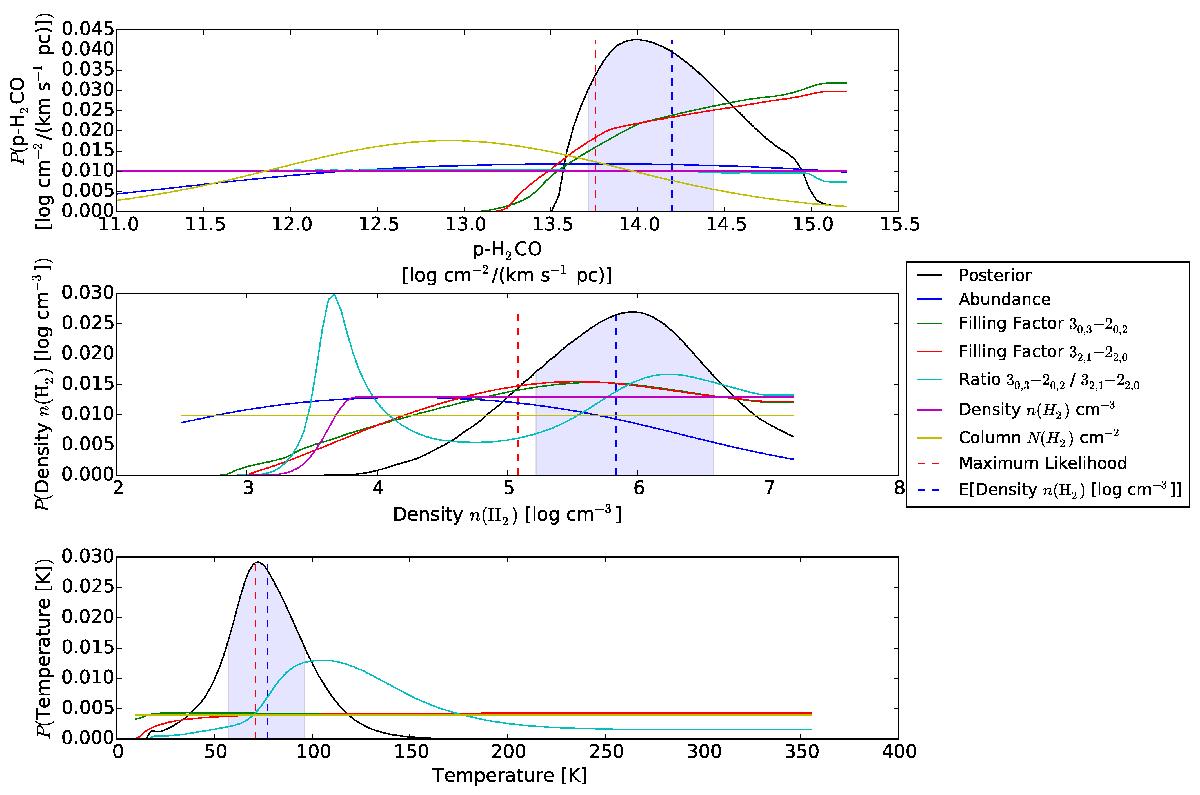
The one-dimensional probability distributions for each parameter. The legend describes the lines. The blue shaded area shows the highest 68% probability region. The maximum-likelihood and expectation value are generally close for temperature but can be very different for column and density.
Current usage metrics show cumulative count of Article Views (full-text article views including HTML views, PDF and ePub downloads, according to the available data) and Abstracts Views on Vision4Press platform.
Data correspond to usage on the plateform after 2015. The current usage metrics is available 48-96 hours after online publication and is updated daily on week days.
Initial download of the metrics may take a while.