Fig. D.4
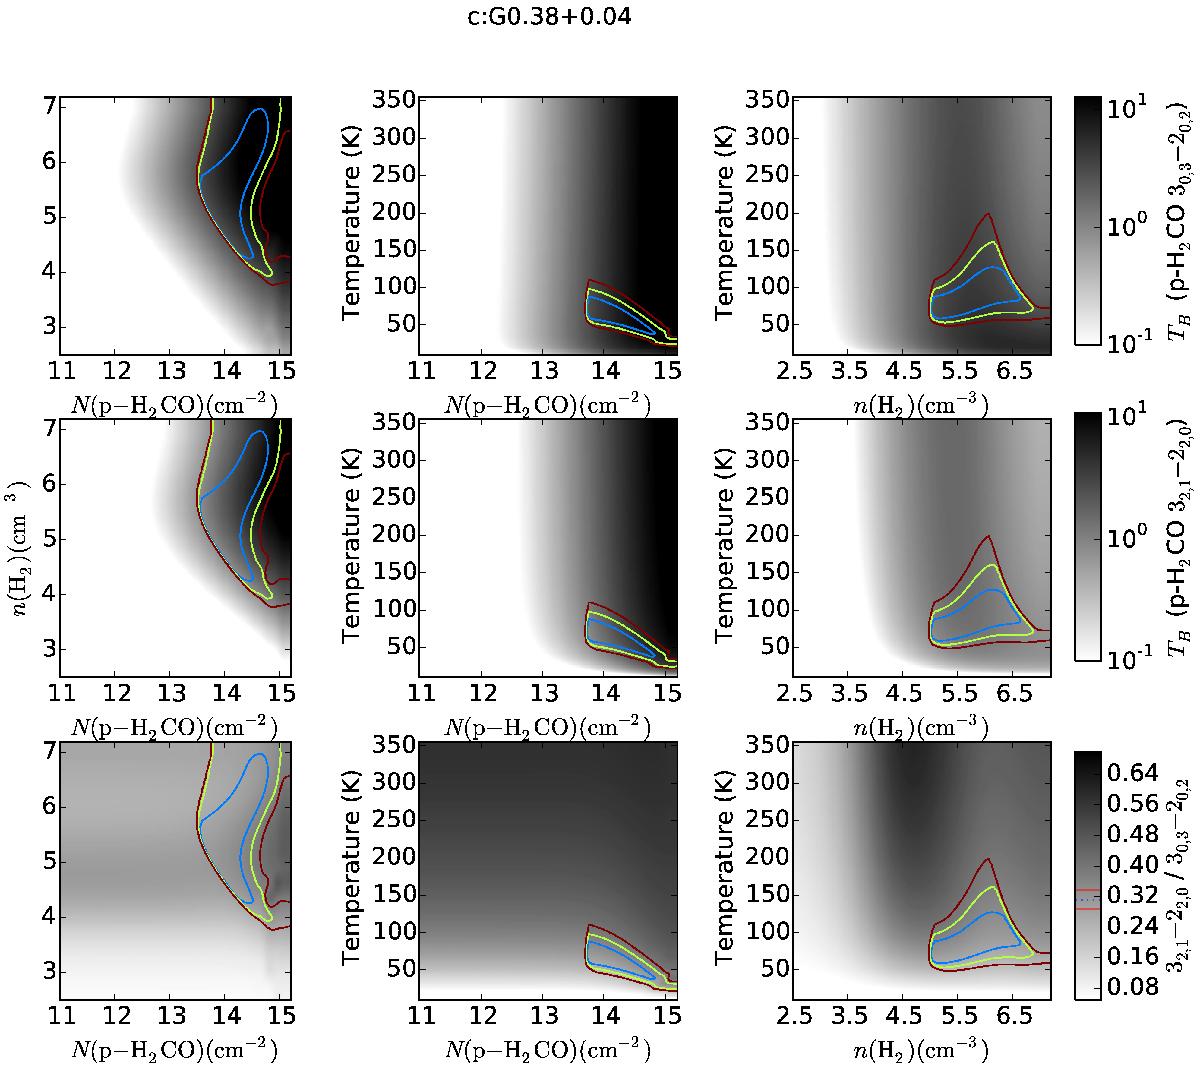
The line brightness of p - H2CO30,3−20,2 (top row) and p - H2CO32,1−22,0 (middle row) and p - H2CO Sν(32,1−22,0) /Sν(30,3−20,2) (bottom row) in the three different projections of parameter space. The grayscale images correspond to a slice through the parameter spaces at the location of the best-fit parameter. The colored contours show the allowed marginalized regions in each parameter space as described in the Fig. D.1 caption.
Current usage metrics show cumulative count of Article Views (full-text article views including HTML views, PDF and ePub downloads, according to the available data) and Abstracts Views on Vision4Press platform.
Data correspond to usage on the plateform after 2015. The current usage metrics is available 48-96 hours after online publication and is updated daily on week days.
Initial download of the metrics may take a while.