Free Access
Fig. 16
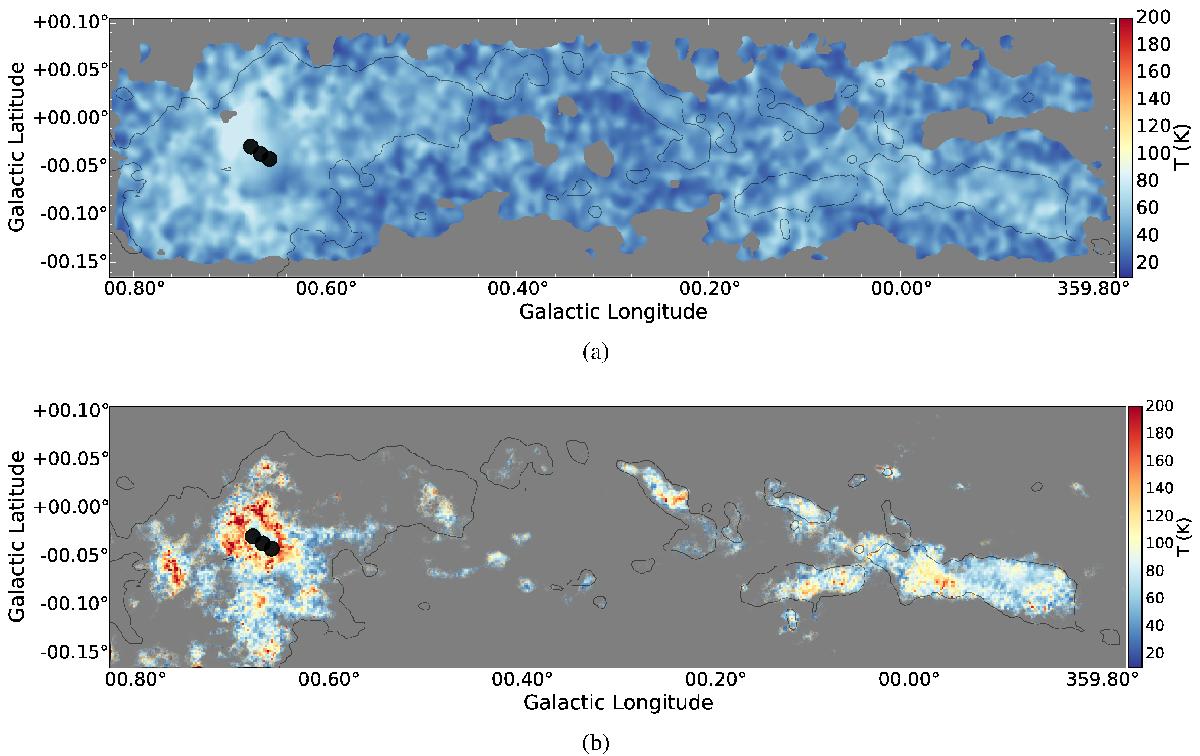
a) A temperature map derived from the NH3 (1, 1)/(2, 2) line ratio from Ott et al. (2014). The NH3 thermometer has a more limited temperature range when using only these two lines, so the map is cut off at TG = 80 K. b) The p - H2CO-derived temperature map over the same region from Fig. 7a.
This figure is made of several images, please see below:
Current usage metrics show cumulative count of Article Views (full-text article views including HTML views, PDF and ePub downloads, according to the available data) and Abstracts Views on Vision4Press platform.
Data correspond to usage on the plateform after 2015. The current usage metrics is available 48-96 hours after online publication and is updated daily on week days.
Initial download of the metrics may take a while.