Fig. 13
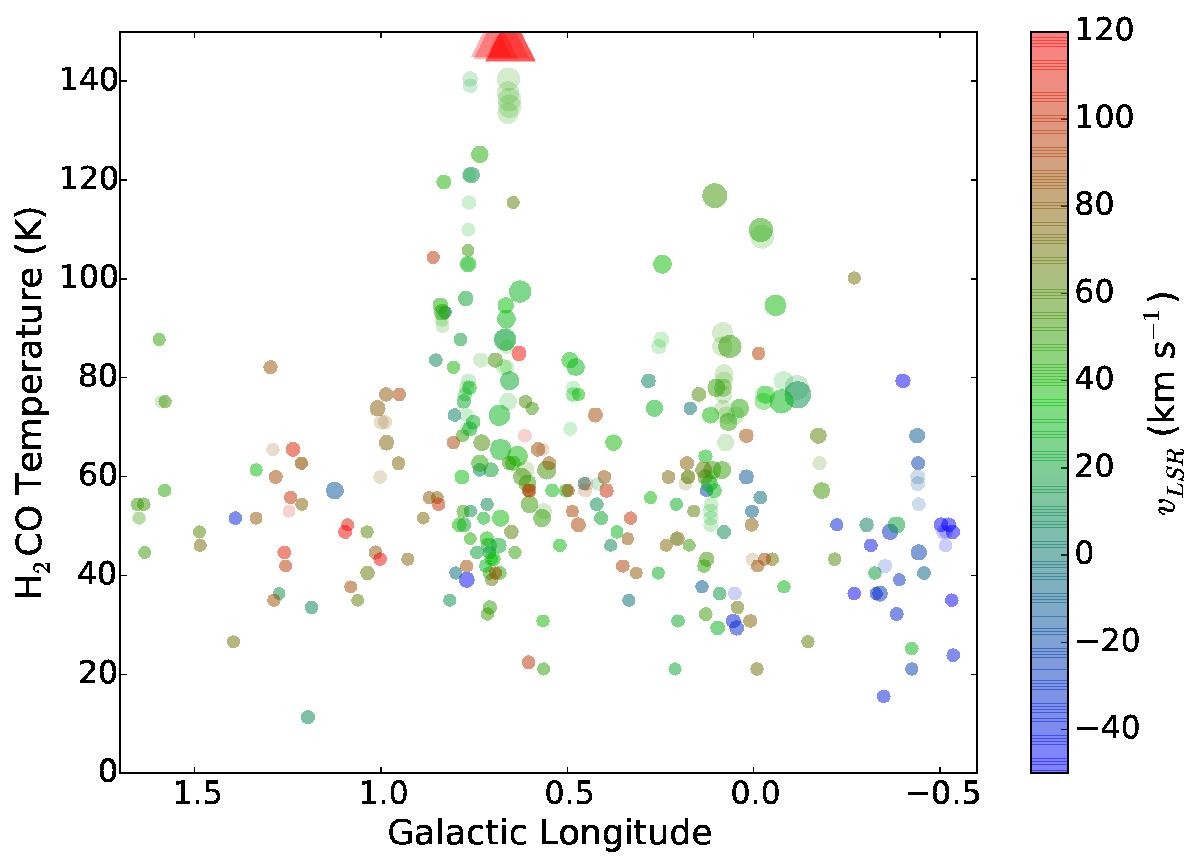
Derived temperature as a function of longitude colored by LSR velocity for dendrogram-extracted data. The points have a size proportional to the 30,3−20,2 line brightness. The more transparent points reflect ancestors in the dendrogram tree, while the opaque points show leaves. Lower limits for some of the Sgr B2 regions are shown as red upward-pointing triangles near the top of the plot.
Current usage metrics show cumulative count of Article Views (full-text article views including HTML views, PDF and ePub downloads, according to the available data) and Abstracts Views on Vision4Press platform.
Data correspond to usage on the plateform after 2015. The current usage metrics is available 48-96 hours after online publication and is updated daily on week days.
Initial download of the metrics may take a while.