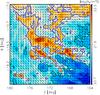
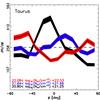
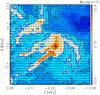
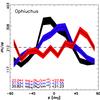
Fig. 3
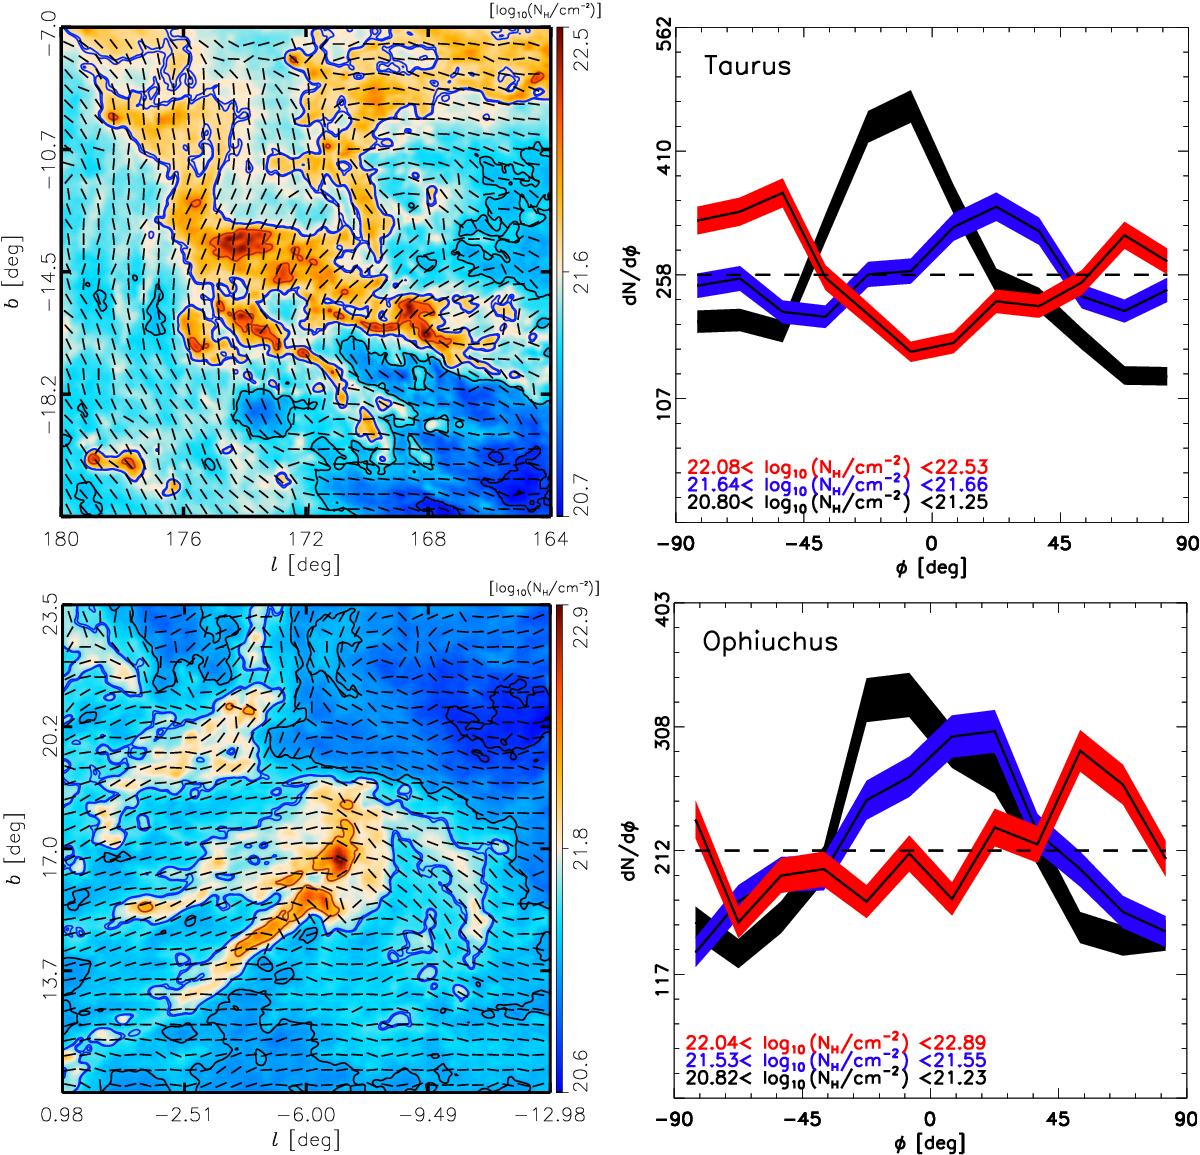
Left: columm density map, log 10(NH/ cm-2), overlaid with magnetic field pseudo-vectors whose orientations are inferred from the Planck 353 GHz polarization observations. The length of the pseudo-vectors is normalized so does not reflect the polarization fraction. In this first group, the regions analysed are, from top to bottom, Taurus, Ophiuchus, Lupus, Chamaeleon-Musca, and CrA. Right: HROs for the lowest, an intermediate, and the highest NH bin (black, blue, and red, respectively). For a given region, bins have equal numbers of selected pixels (see Sect. 4.1.1 and Appendix A) within the NH ranges labelled. The intermediate bin corresponds to selected pixels near the blue contours in the column density images. The horizontal dashed line corresponds to the average per angle bin of 15°. The widths of the shaded areas for each histogram correspond to the ± 1σ uncertainties related to the histogram binning operation. Histograms peaking at 0° correspond to B⊥ predominantly aligned with iso-NH contours. Histograms peaking at 90° and/or − 90° correspond to B⊥ predominantly perpendicular to iso-NH contours.
Current usage metrics show cumulative count of Article Views (full-text article views including HTML views, PDF and ePub downloads, according to the available data) and Abstracts Views on Vision4Press platform.
Data correspond to usage on the plateform after 2015. The current usage metrics is available 48-96 hours after online publication and is updated daily on week days.
Initial download of the metrics may take a while.