Free Access
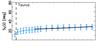
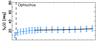
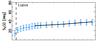
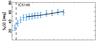
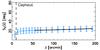
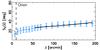
Fig. D.2
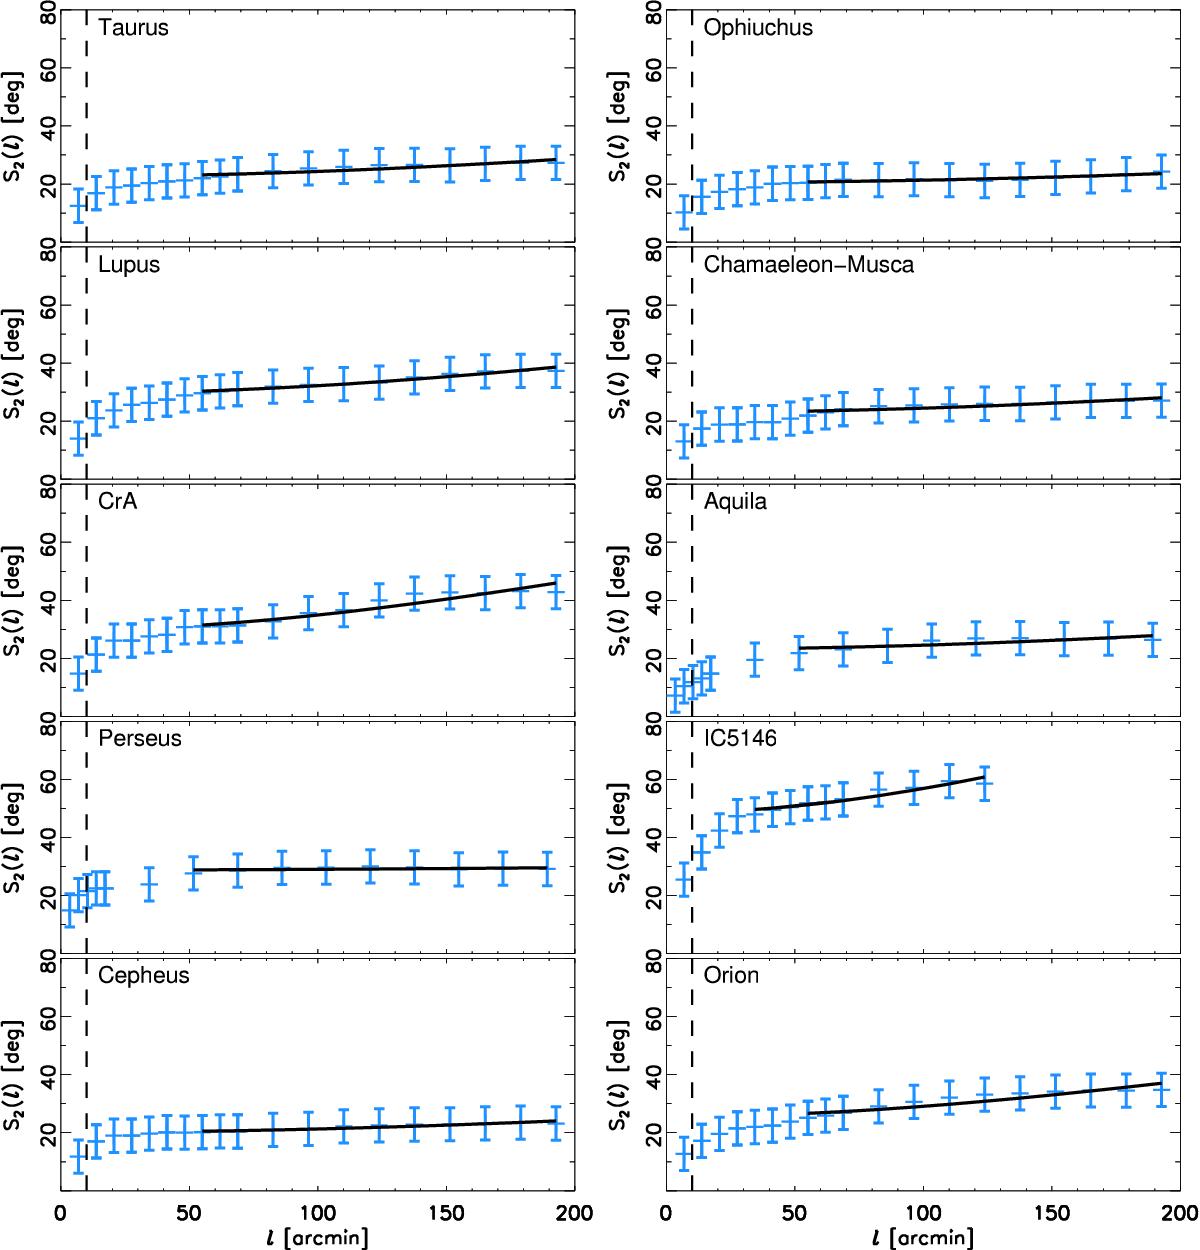
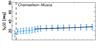
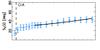
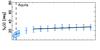
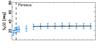
Structure function S2(ℓ) calculated from the Q and U maps of the selected regions following Eq. (D.4). The black lines indicate the fits given by Eq. (D.6). The vertical dashed line marks the common 10′ resolution of the data used in the analysis; the data are correlated for low values of ℓ causing the drop in S2(ℓ).
This figure is made of several images, please see below:
Current usage metrics show cumulative count of Article Views (full-text article views including HTML views, PDF and ePub downloads, according to the available data) and Abstracts Views on Vision4Press platform.
Data correspond to usage on the plateform after 2015. The current usage metrics is available 48-96 hours after online publication and is updated daily on week days.
Initial download of the metrics may take a while.