Fig. C.5
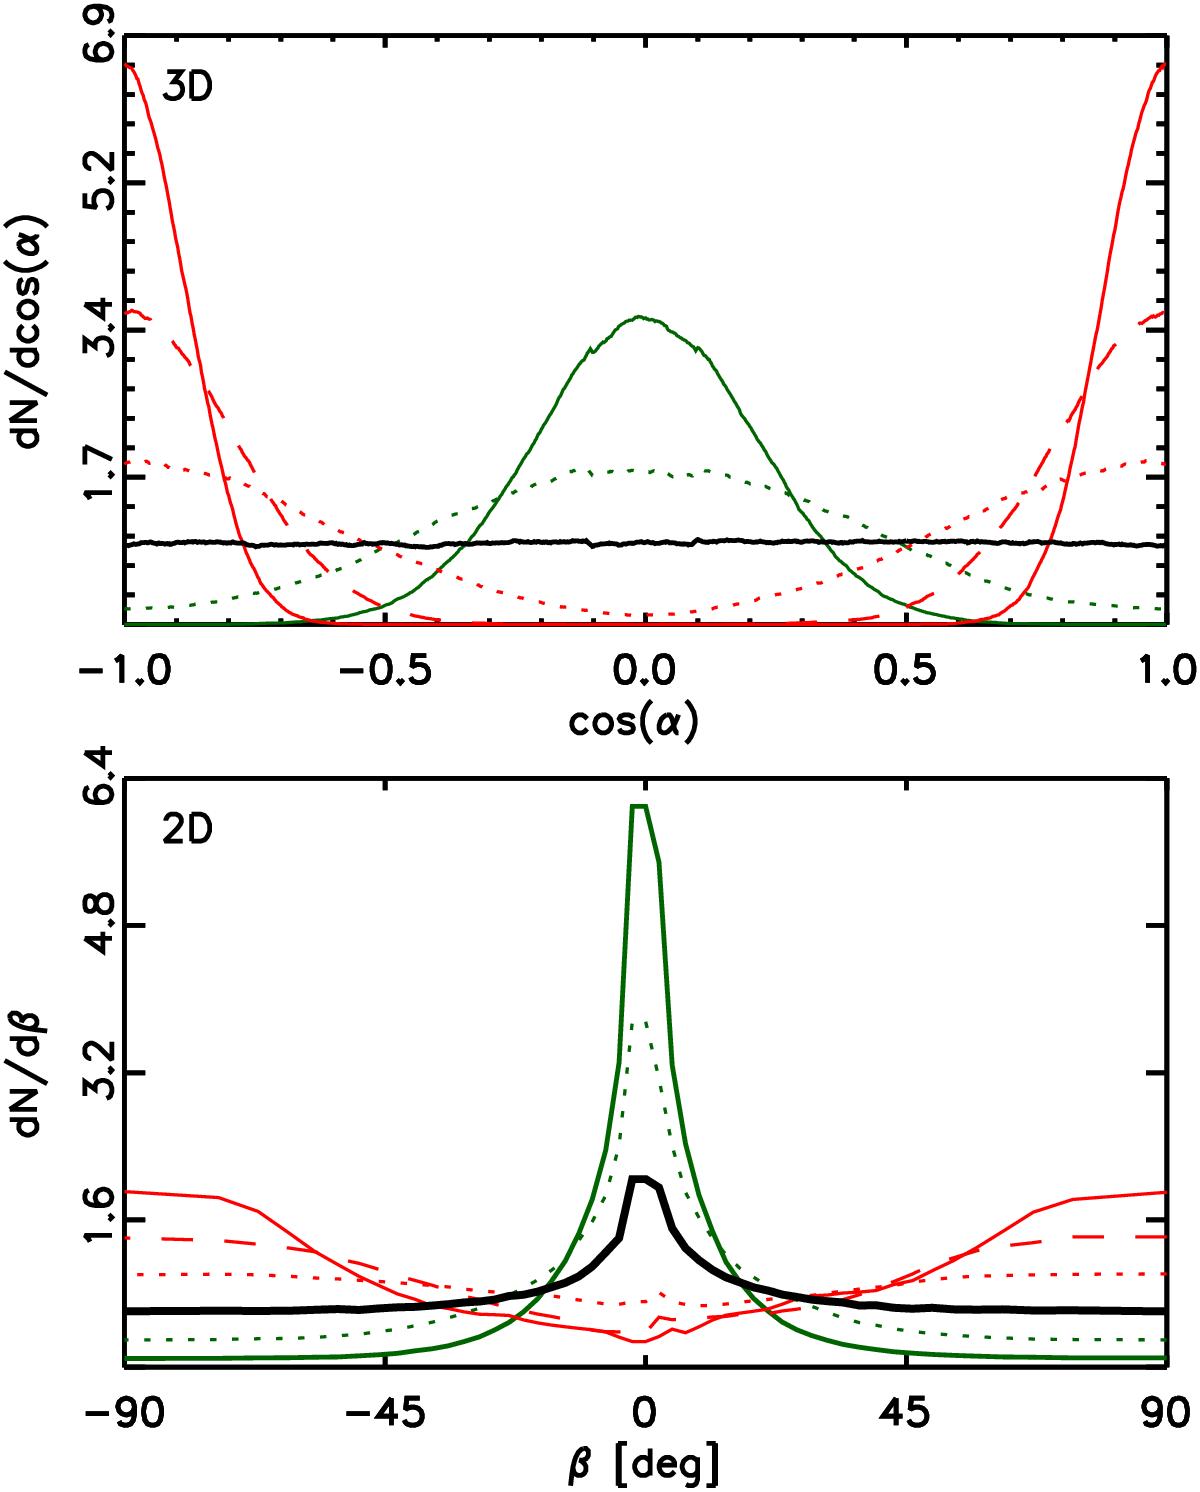
Normalized distributions of relative orientations of random vectors in 3D (top) and of their projections in 2D (bottom). The curves correspond to mostly perpendicular vectors (red), uniform distribution of relative orientations (black), and mostly parallel vectors (green). The solid, dashed, and dotted lines correspond to dispersions of the relative orientation angle ςα = 18°, 36°, and 72°, respectively.
Current usage metrics show cumulative count of Article Views (full-text article views including HTML views, PDF and ePub downloads, according to the available data) and Abstracts Views on Vision4Press platform.
Data correspond to usage on the plateform after 2015. The current usage metrics is available 48-96 hours after online publication and is updated daily on week days.
Initial download of the metrics may take a while.