Fig. C.1
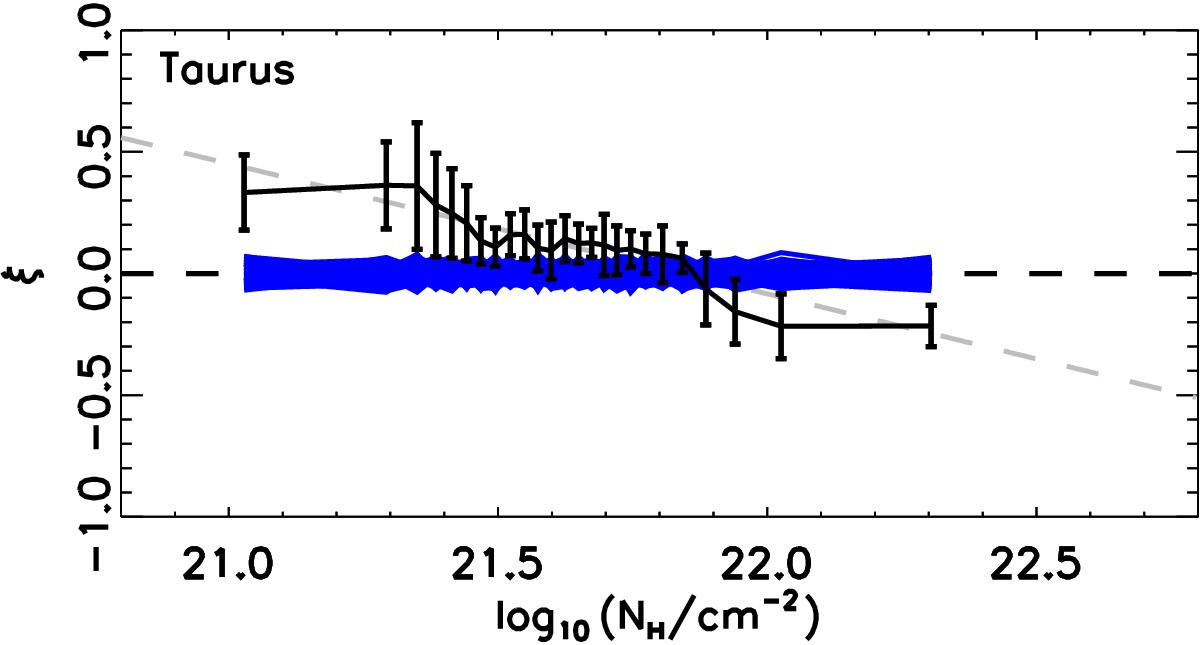
Histogram shape parameter, ξ, as a function of log 10(NH/ cm-2) in the Taurus region. Blue lines join the ξ values obtained using the τ353 map at 10′ resolution and each of 1000 random realizations of Q and U maps corresponding to a uniform distribution of ψ. Results in black and grey are from the analysis of the Planck data, as reported in Fig. 7.
Current usage metrics show cumulative count of Article Views (full-text article views including HTML views, PDF and ePub downloads, according to the available data) and Abstracts Views on Vision4Press platform.
Data correspond to usage on the plateform after 2015. The current usage metrics is available 48-96 hours after online publication and is updated daily on week days.
Initial download of the metrics may take a while.