Fig. B.2
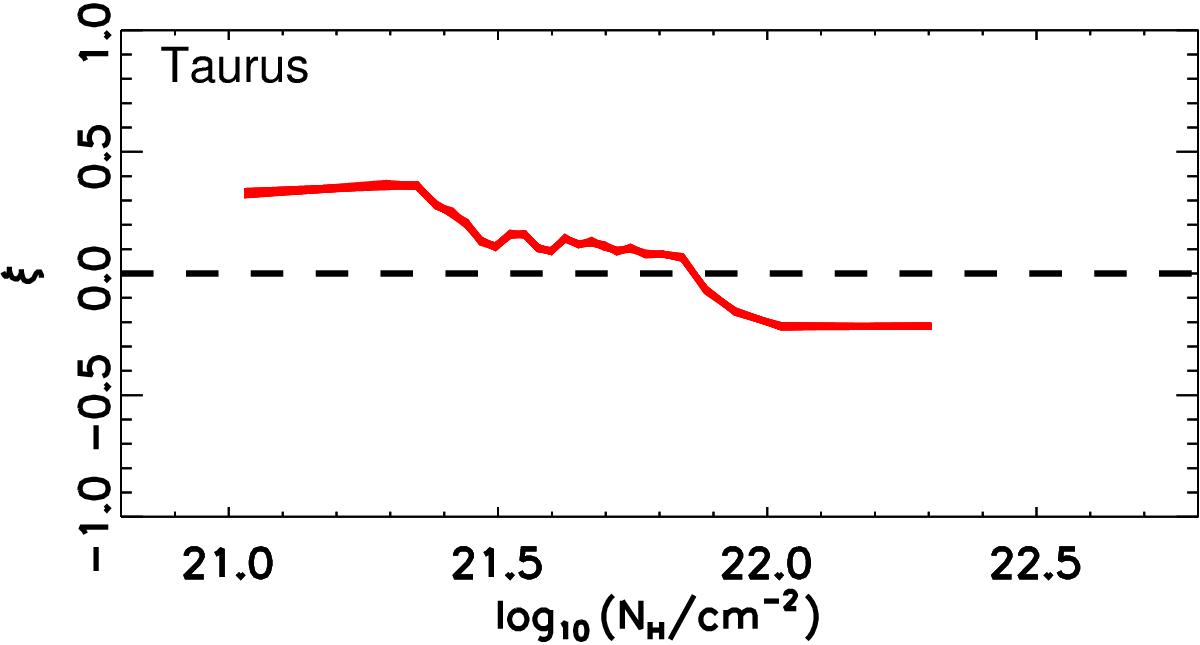
Histogram shape parameter, ξ, as a function of log 10(NH/ cm-2) in the Taurus region. The values are obtained using the τ353 map at 10′ resolution and maps of the Stokes parameters Qr and Ur that correspond to 1000 random-noise realizations. Each realization is generated using a Gaussian probability density function centred on the measured values Q and Uwith variances ![]() and
and ![]() . By joining the values at each NH bin, we find a trend very close to the black line in Fig. 7, with little dispersion from the noise; much larger are the uncertainties in evaluating ξ at each NH bin, as given in Fig. 7 but not shown here.
. By joining the values at each NH bin, we find a trend very close to the black line in Fig. 7, with little dispersion from the noise; much larger are the uncertainties in evaluating ξ at each NH bin, as given in Fig. 7 but not shown here.
Current usage metrics show cumulative count of Article Views (full-text article views including HTML views, PDF and ePub downloads, according to the available data) and Abstracts Views on Vision4Press platform.
Data correspond to usage on the plateform after 2015. The current usage metrics is available 48-96 hours after online publication and is updated daily on week days.
Initial download of the metrics may take a while.